- EasyCard
- Trade
- Help
- Announcement
- Academy
- SWIFT Code
- Iban Number
- Referral
- Customer Service
- Blog
- Creator
How to choose a 2025 US stock ETF? 8 ETFs including QQQ, VOO, SPY, etc. will help you easily outperform the market!


Since the implementation of the large-scale Quantitative Easing policy by the Federal Reserve, large-cap stocks like Google and Microsoft have unexpectedly experienced strong rebounds after adjustments during the epidemic period, with stock prices soaring to new highs. What about ETFs closely related to stocks?

From 2019 to now, the total market value of US stock ETFs has also increased from $4.30 trillion to $7.30 trillion, which fully proves that holding ETFs for a long time can achieve considerable growth through compound interest.
Although investing in US stock ETFs is a good choice, how to choose the most worthwhile one when facing numerous ETFs? Don’t worry, in this article, the editor will take you to understand the reasons for investing in US stock ETFs and 8 ETFs worth paying attention to.
Why must we invest in US stock ETFs?
ETF is a passive fund designed to track specific indices and provide investors with a simple, diversified, and low-cost investment tool. Due to its wide range of investment targets, ETFs have become an ideal choice to help investors diversify risk and improve stability. Next, let’s take a look at several reasons to invest in US stock ETFs.
1. The US stock market is a gathering place for global companies As one of the largest economies in the world, the economic activities of the US have a profound impact on the global market. Due to the strong liquidity and high trading volume of the US dollar, the US Financial Marekt has attracted many large-scale and well-known companies to go public. Most of these companies are Blue Chips, with stable financial performance and strong growth potential. Investing in US stock ETFs can achieve diversified investment through a basket of these high-quality stocks, reduce the risk of a single company, and also benefit from their higher return potential.
2. US stock ETFs include investments in other parts of the world The high liquidity of the US not only attracts local companies, but also allows ETFs in the international market to enter. For example, VEA and EEM are US stock ETFs that track European and Emerging Markets, providing investors with broader market coverage. Through these ETFs, investors can risk diversify between multiple global markets and cope with uncertainties caused by economic downturns or political changes in a certain region.
3. Multiple options help diversify risk The diversity of the US securities market covers various industries from technology, healthcare, energy to finance. With more and more international companies choosing to list in the US, the types of ETFs are becoming increasingly diverse, meeting the needs of different investors. So far, the number of US stock ETFs has increased from 123 in 2003 to over 2500. This diversification enables investors to build investment portfolios that suit their own risk preferences.
4. Stable long-term returns Although the return rate of US stock ETFs is relatively less volatile than individual stocks, the return on long-term investment is relatively stable. Past data shows that the average annual return rate of investing in US stock ETFs is around 10%, far exceeding most traditional funds and suitable for investors seeking long-term stable returns.
5. High liquidity guarantees flexible trading The US securities market has extremely high liquidity, which makes investors more flexible in buying and selling ETFs and able to quickly respond to market changes. This liquidity not only reduces transaction costs, but also allows investors to avoid the risk of buying difficulties or being unable to sell due to insufficient liquidity.
Which US stock ETFs are worth recommending?
Next, we will briefly introduce the 8 top-ranked ETFs mentioned earlier. These ETFs not only have high trading volume and are more convenient for trading, but also usually have strong funds and long-term trust from investors. At the same time, high-ranked ETFs have lower fees, allowing investors to participate in the US market at more affordable prices.
Here are the top 8 ETF charts ranked based on 10-year long-term returns:
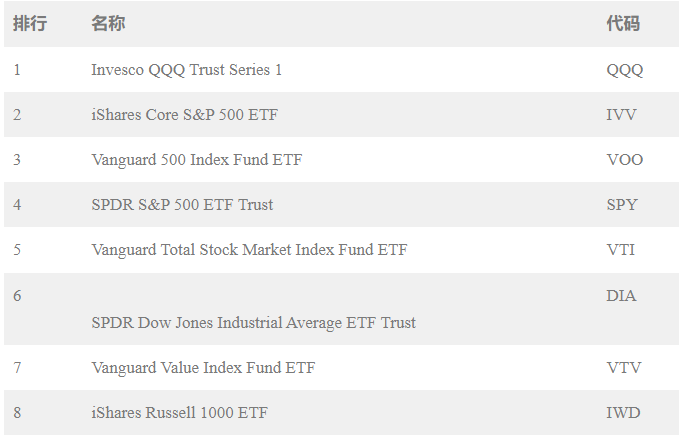
1.Invesco QQQ Trust Series 1(QQQ)
The first is Invesco QQQ Trust Series 1, with the code QQQ. QQQ was founded on March 10, 1999, and its assets have reached 2038.2 billion US dollars. It tracks the Nasdaq Composite Index, which is 2,500 US technology stocks.
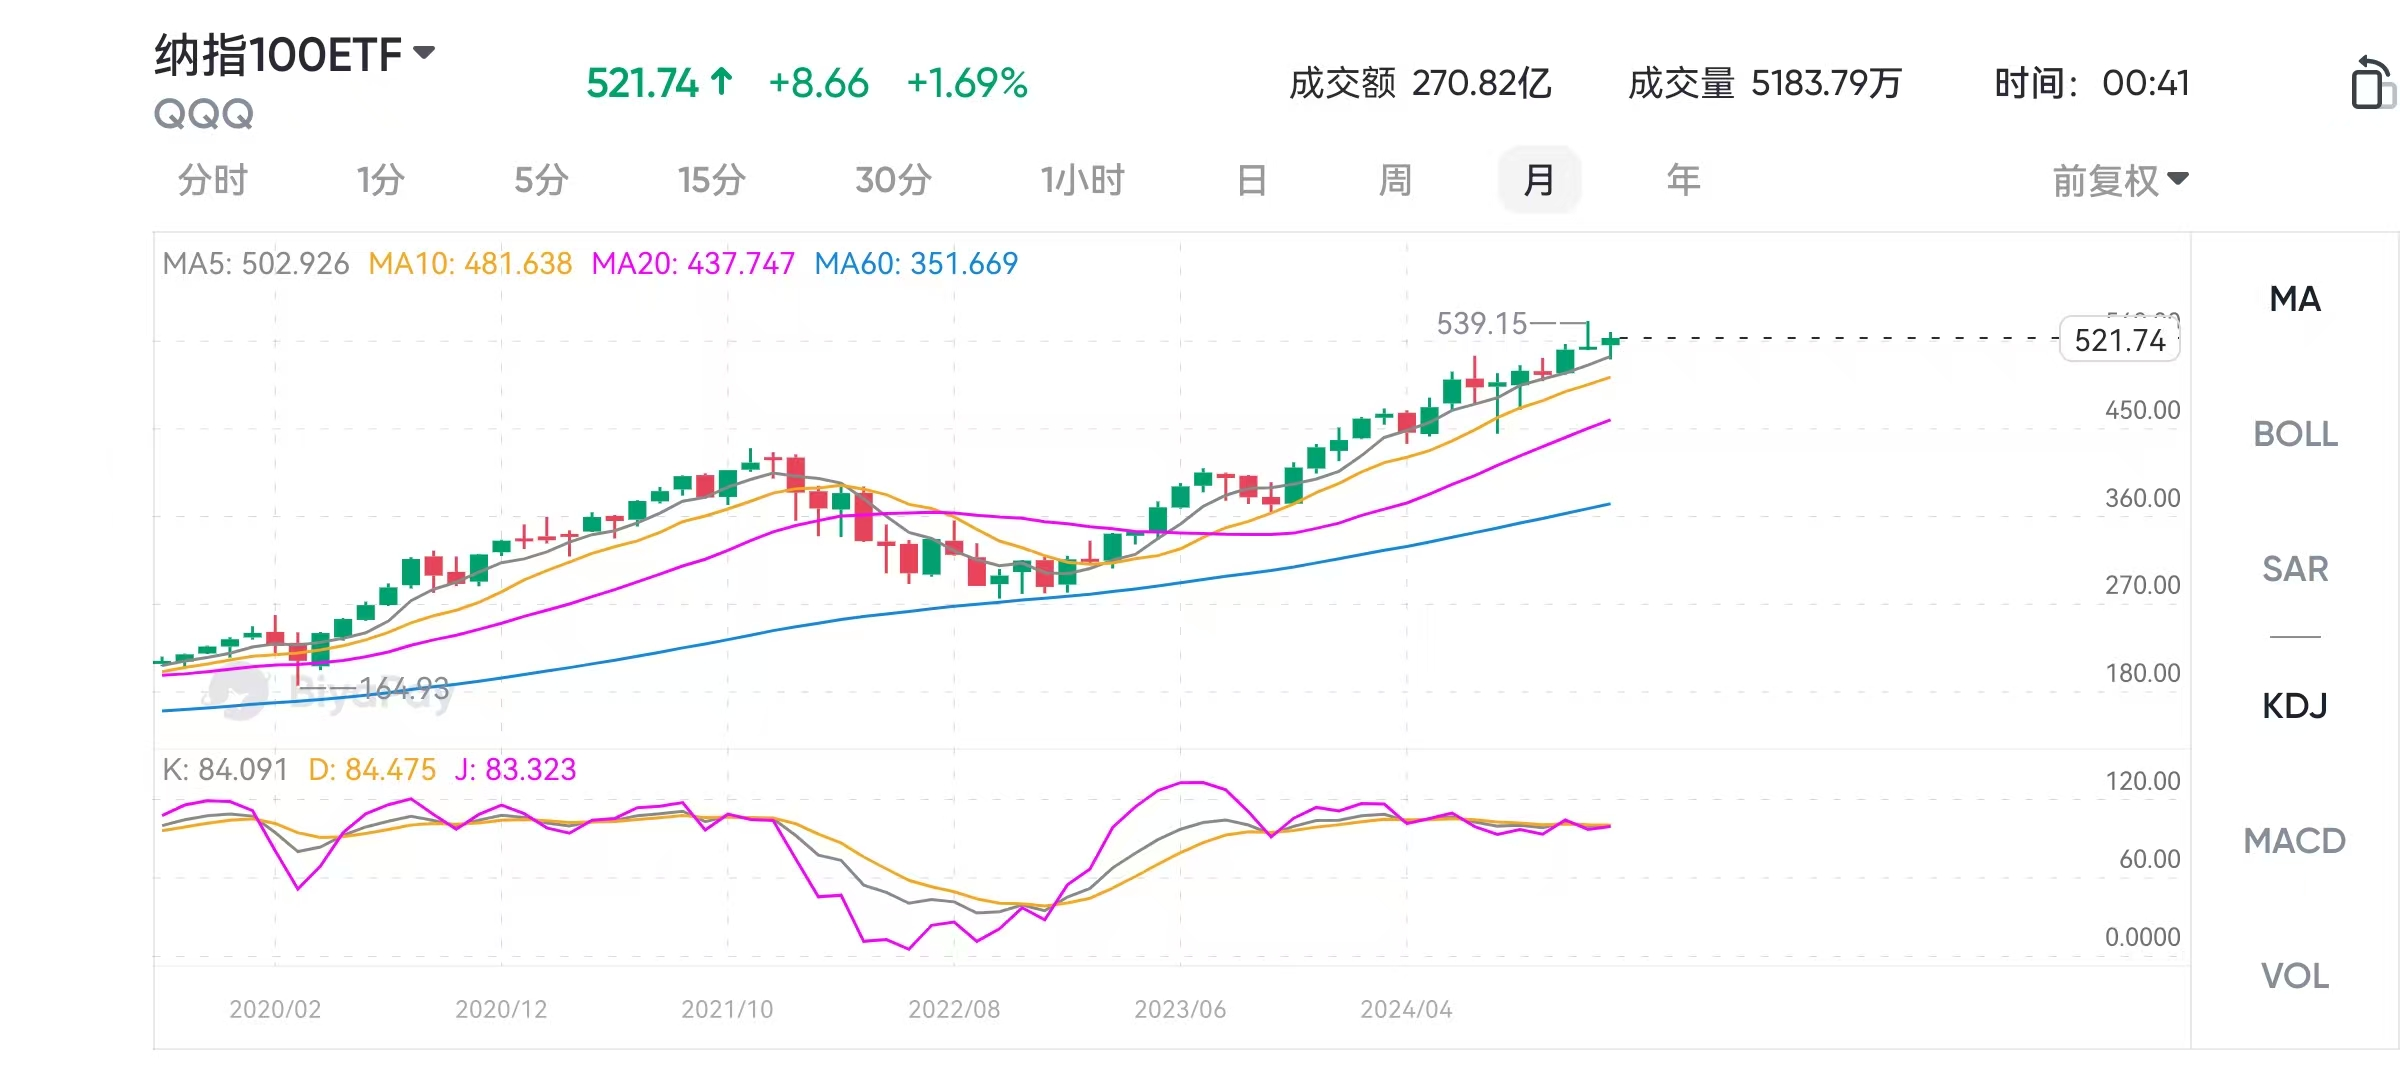
The largest technology stock in QQQ is undoubtedly Apple, accounting for 11.11%. Other constituent stocks include Microsoft with 10.41%, Amazon with 5.60%, Nvidia with 4.62%, and META with 3.93%.
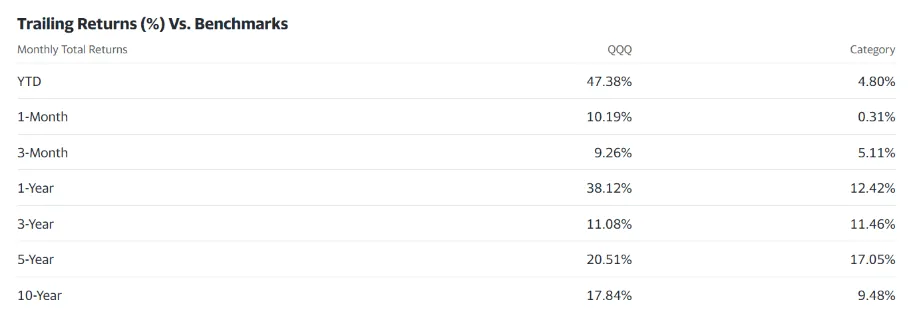
Since QQQ tracks technology stocks, the overall volatility and return will be relatively high. Its return over the past 5 years is 20.51%, while the return over 10 years is 17.84%. From the perspective of dividends, it can be seen that the return over a 5-year cycle is higher than that over a 10-year cycle. In addition, QQQ’s annual internal deduction fee is 0.2%, which is suitable for investors who are interested in technology stocks but have limited funds.
2.iShares Core S&P 500 ETF(IVV)
The second ETF, also tracking the S & P 500, is the iShares Core S & P 500 ETF, with the code IVV. IVV was established on May 15, 2000, with assets of $344.75 billion.
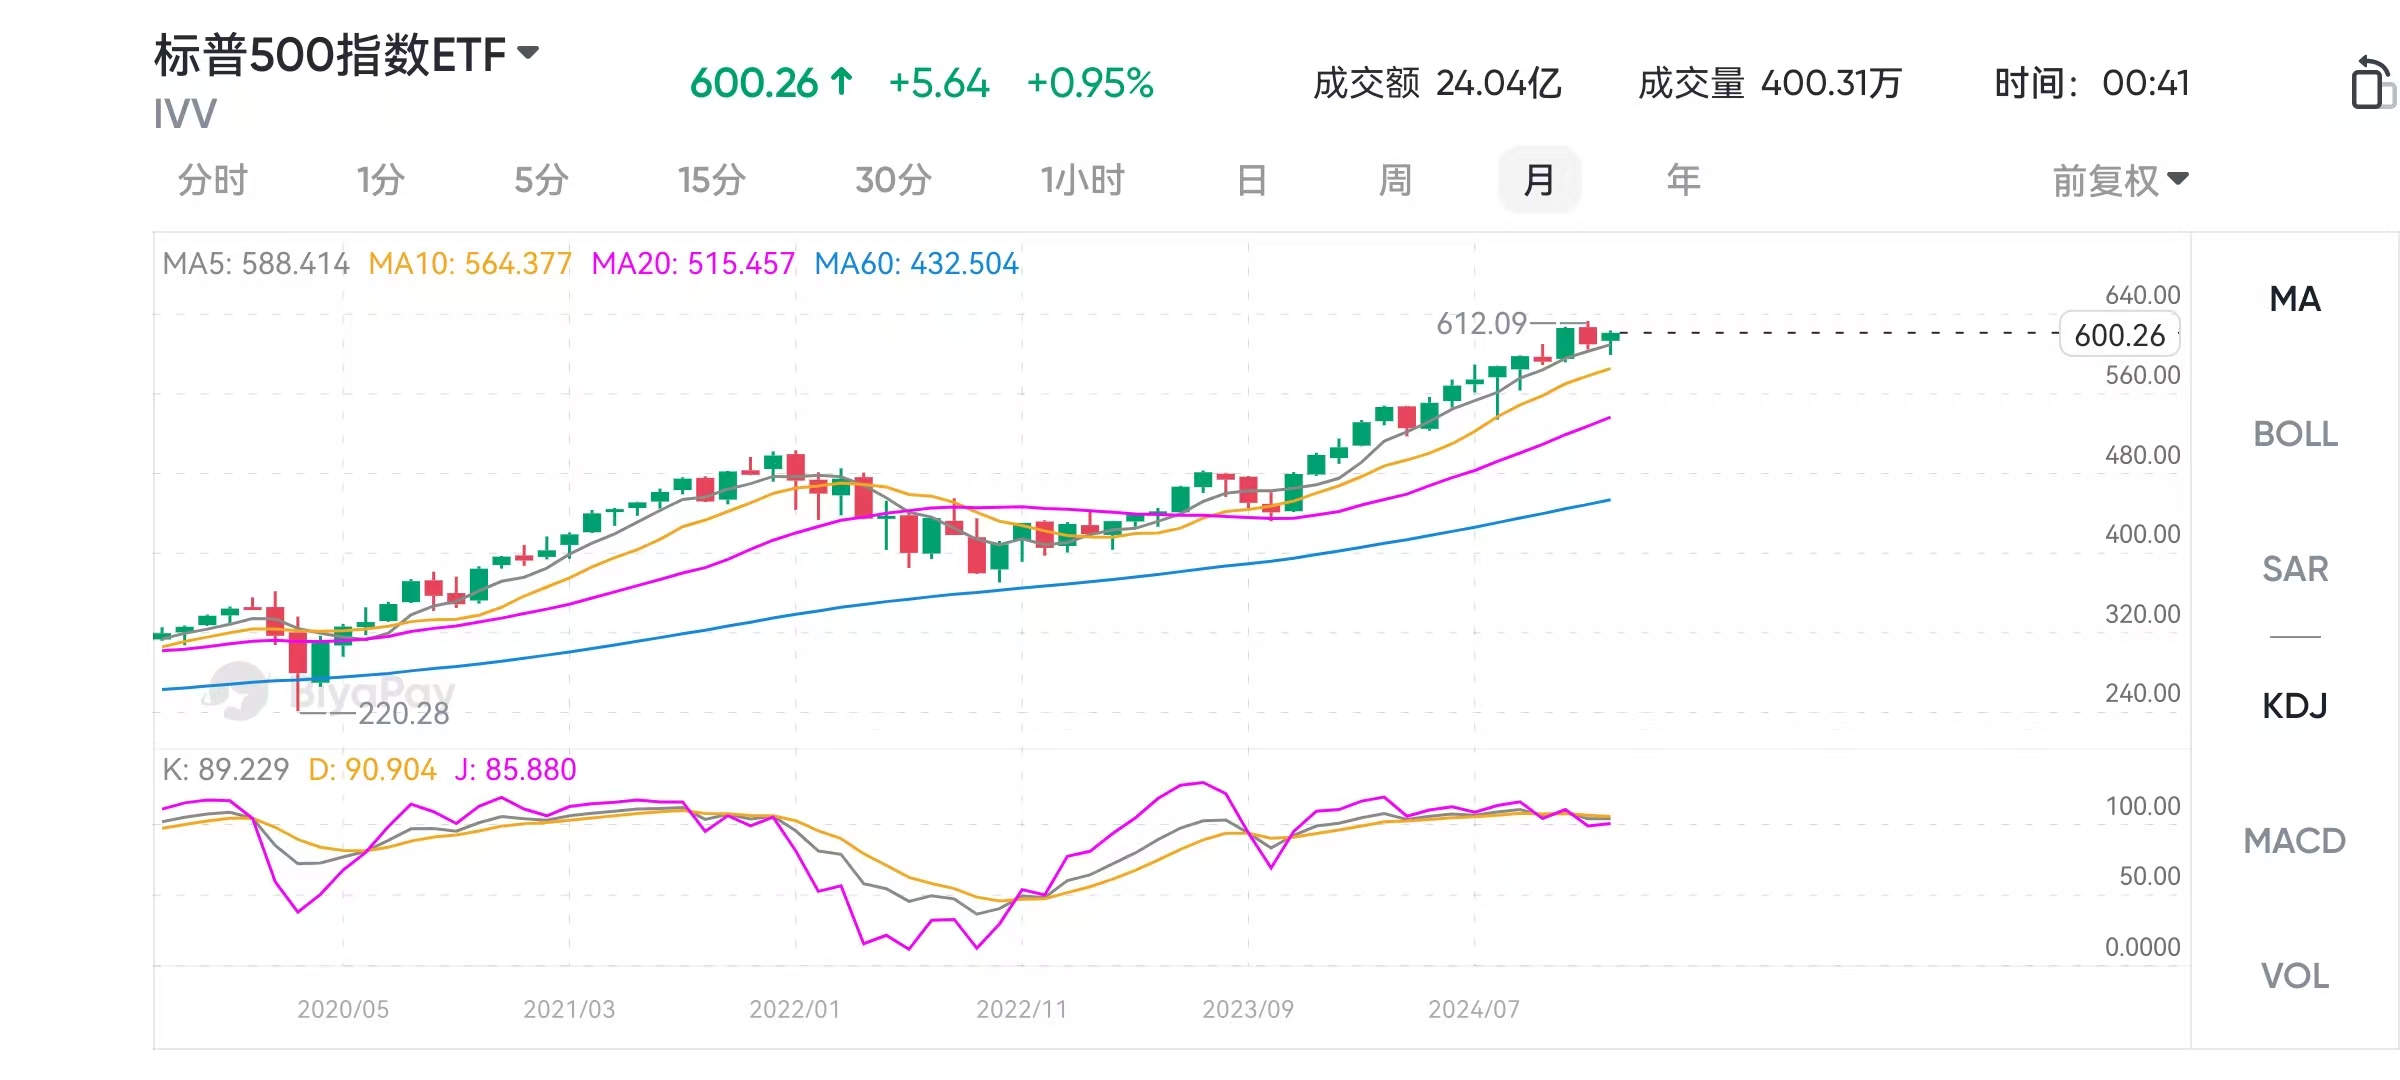
Similarly, the top 5 constituent stocks of IVV are Apple with 7.34%, Microsoft with 7.24%, Amazon with 3.47%, Nvidia with 3.21%, and Google with 2.12%.
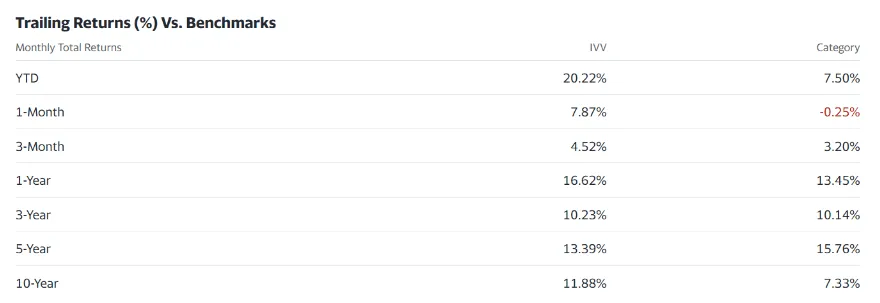
From the perspective of interest distribution, the return on investment for IVV over 5 years is 13.39%, while the return on investment over 10 years is 11.88%, indicating a relatively high return over 5 years. In addition, the cost of IVV, like VOO, is an annual deduction of 0.03%.
3. Vanguard 500 Index Fund ETF(VOO)
Ranked third is the Vanguard 500 Index Fund ETF, with the code VOO. VOO was established on July 9, 2010, specifically tracking the S & P 500 index. Simply put, VOO tracks the top 500 US companies with a market capitalization of more than $10 billion and assets of $322.60 billion. VOO has the second highest asset size among many ETFs tracking the S & P 500.
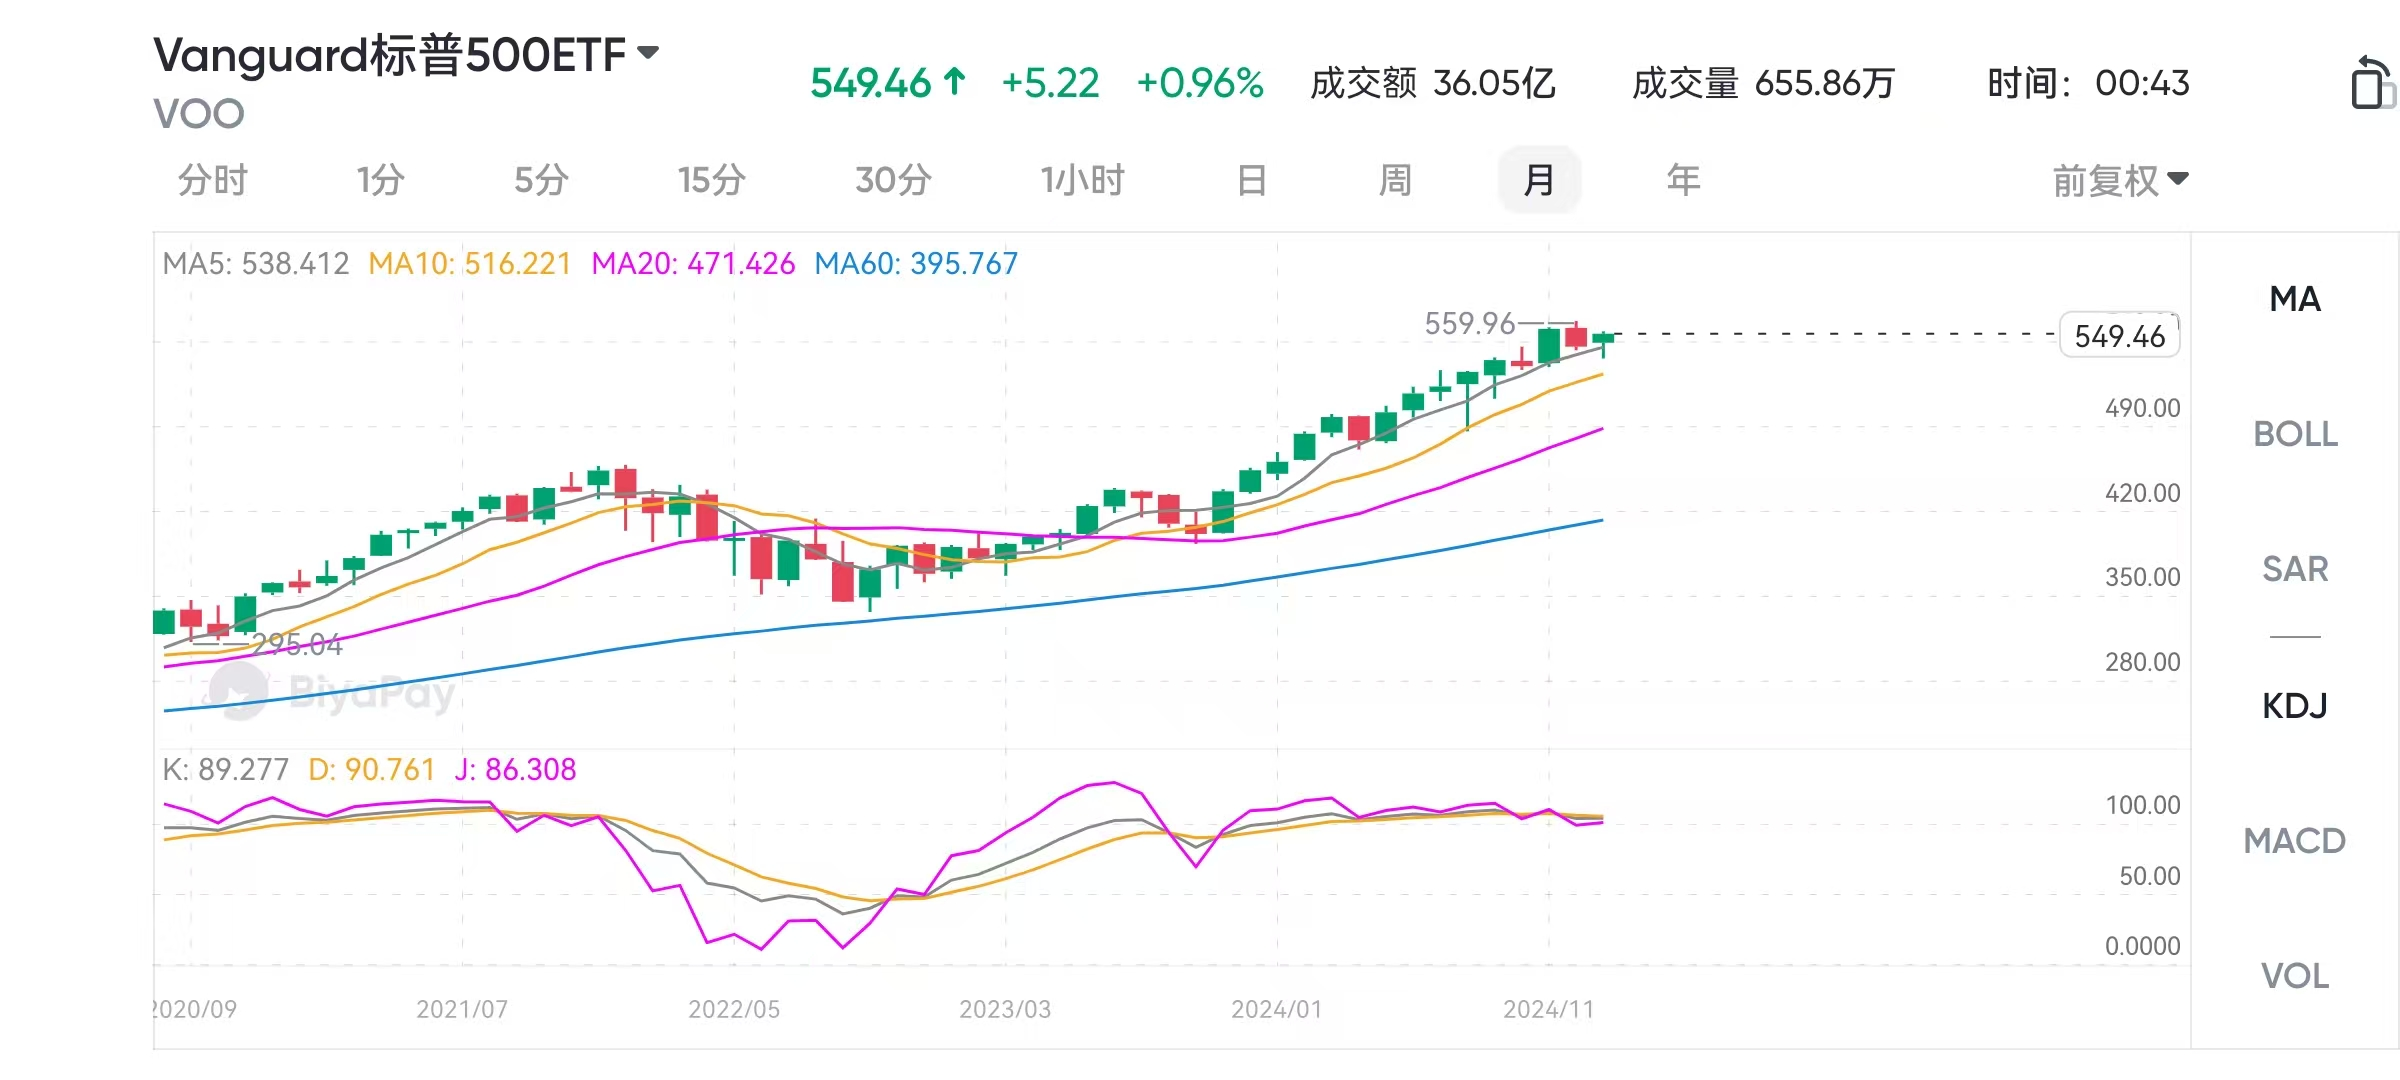
Asset size is very important because it determines the importance of an ETF in the market. When the asset size of an ETF is high, we know that its probability of experiencing losses will be relatively low because its market share is higher. In VOO, the top 5 constituent stocks are Apple and Microsoft, which account for 7.12%, Amazon, 2.86%, and Google, which account for 2.09%.
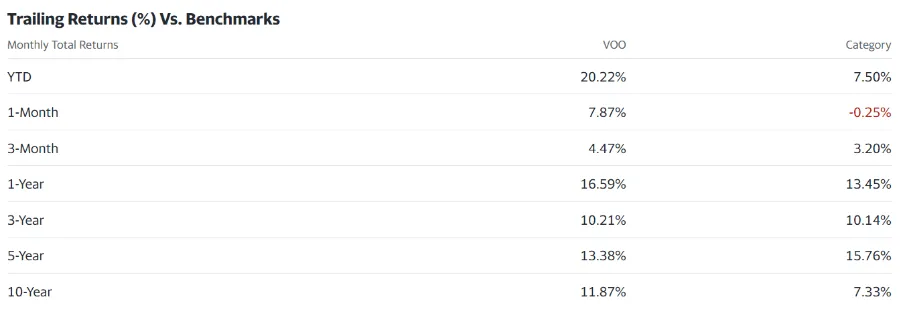
In terms of dividends, VOO’s average return over 5 years is 13.38%, while over 10 years it is 11.87%. From the perspective of dividends, it can be seen that the return over a 5-year cycle is 1.51% higher than that over a 10-year cycle. In addition, VOO has one of the lowest fees in ETFs, which is the 0.03% internal deduction fee automatically taken out by the fund from investment funds each year.
4.SPDR S&P 500 ETF Trust(SPY)
Ranked fourth is the SPDR S & P 500 ETF Trust, with the code SPY. SPY is the oldest fund among all S & P 500 ETFs, established on January 22, 1993. As the earliest established S & P 500 ETF, its asset size is naturally the highest among all S & P 500 ETFs, reaching as much as $478 billion.
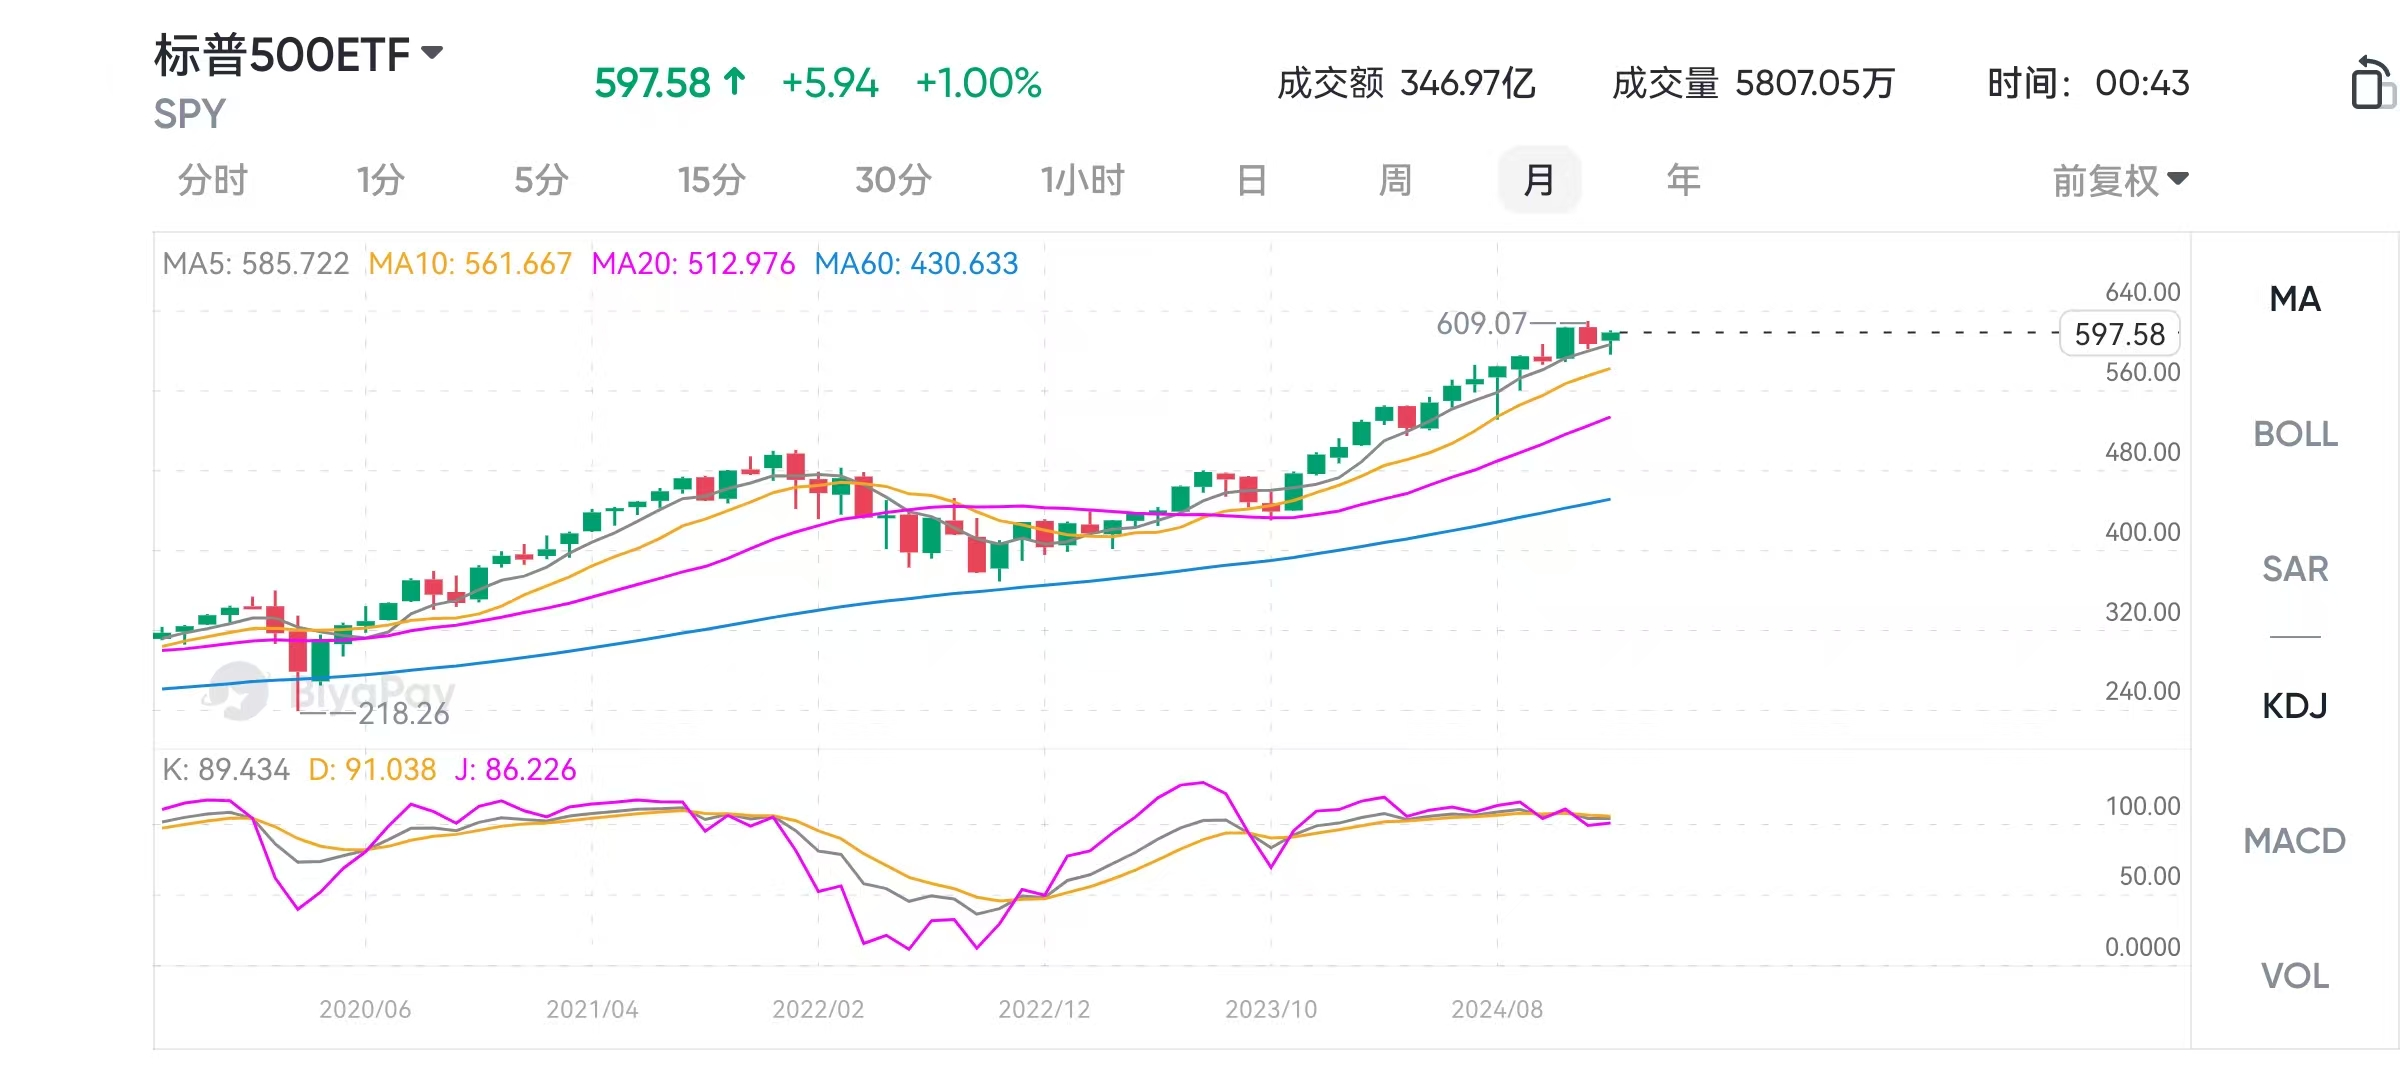
In SPY, the highest Constituent Stocks are Apple with 7.00%, Microsoft with 6.53%, Amazon with 3.21%, NVIDIA with 2.99%, and Google with 2.16%.
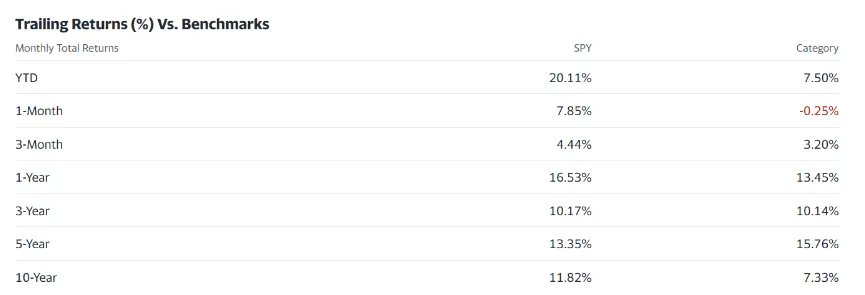
From the perspective of dividends, the return of SPY over 5 years is 13.35%, while over 10 years it is 11.82%. Although SPY is not the highest return among S & P 500 ETFs, it is relatively easy to buy and sell due to its high liquidity. Finally, SPY takes 0.0945% of investment funds as internal deduction fees every year.
5.Vanguard Total Stock Market Index Fund ETF(VTI)
Ranked fifth is the Vanguard Total Stock Market Index Fund ETF, with the code VTI. VTI was established on May 24, 2001, with an asset size of 2938.1 billion US dollars. It tracks the CRSP US All Market Index, which represents the performance of the entire US stock market and covers approximately 4,000 companies, making it the widest investment target in the entire ranking.
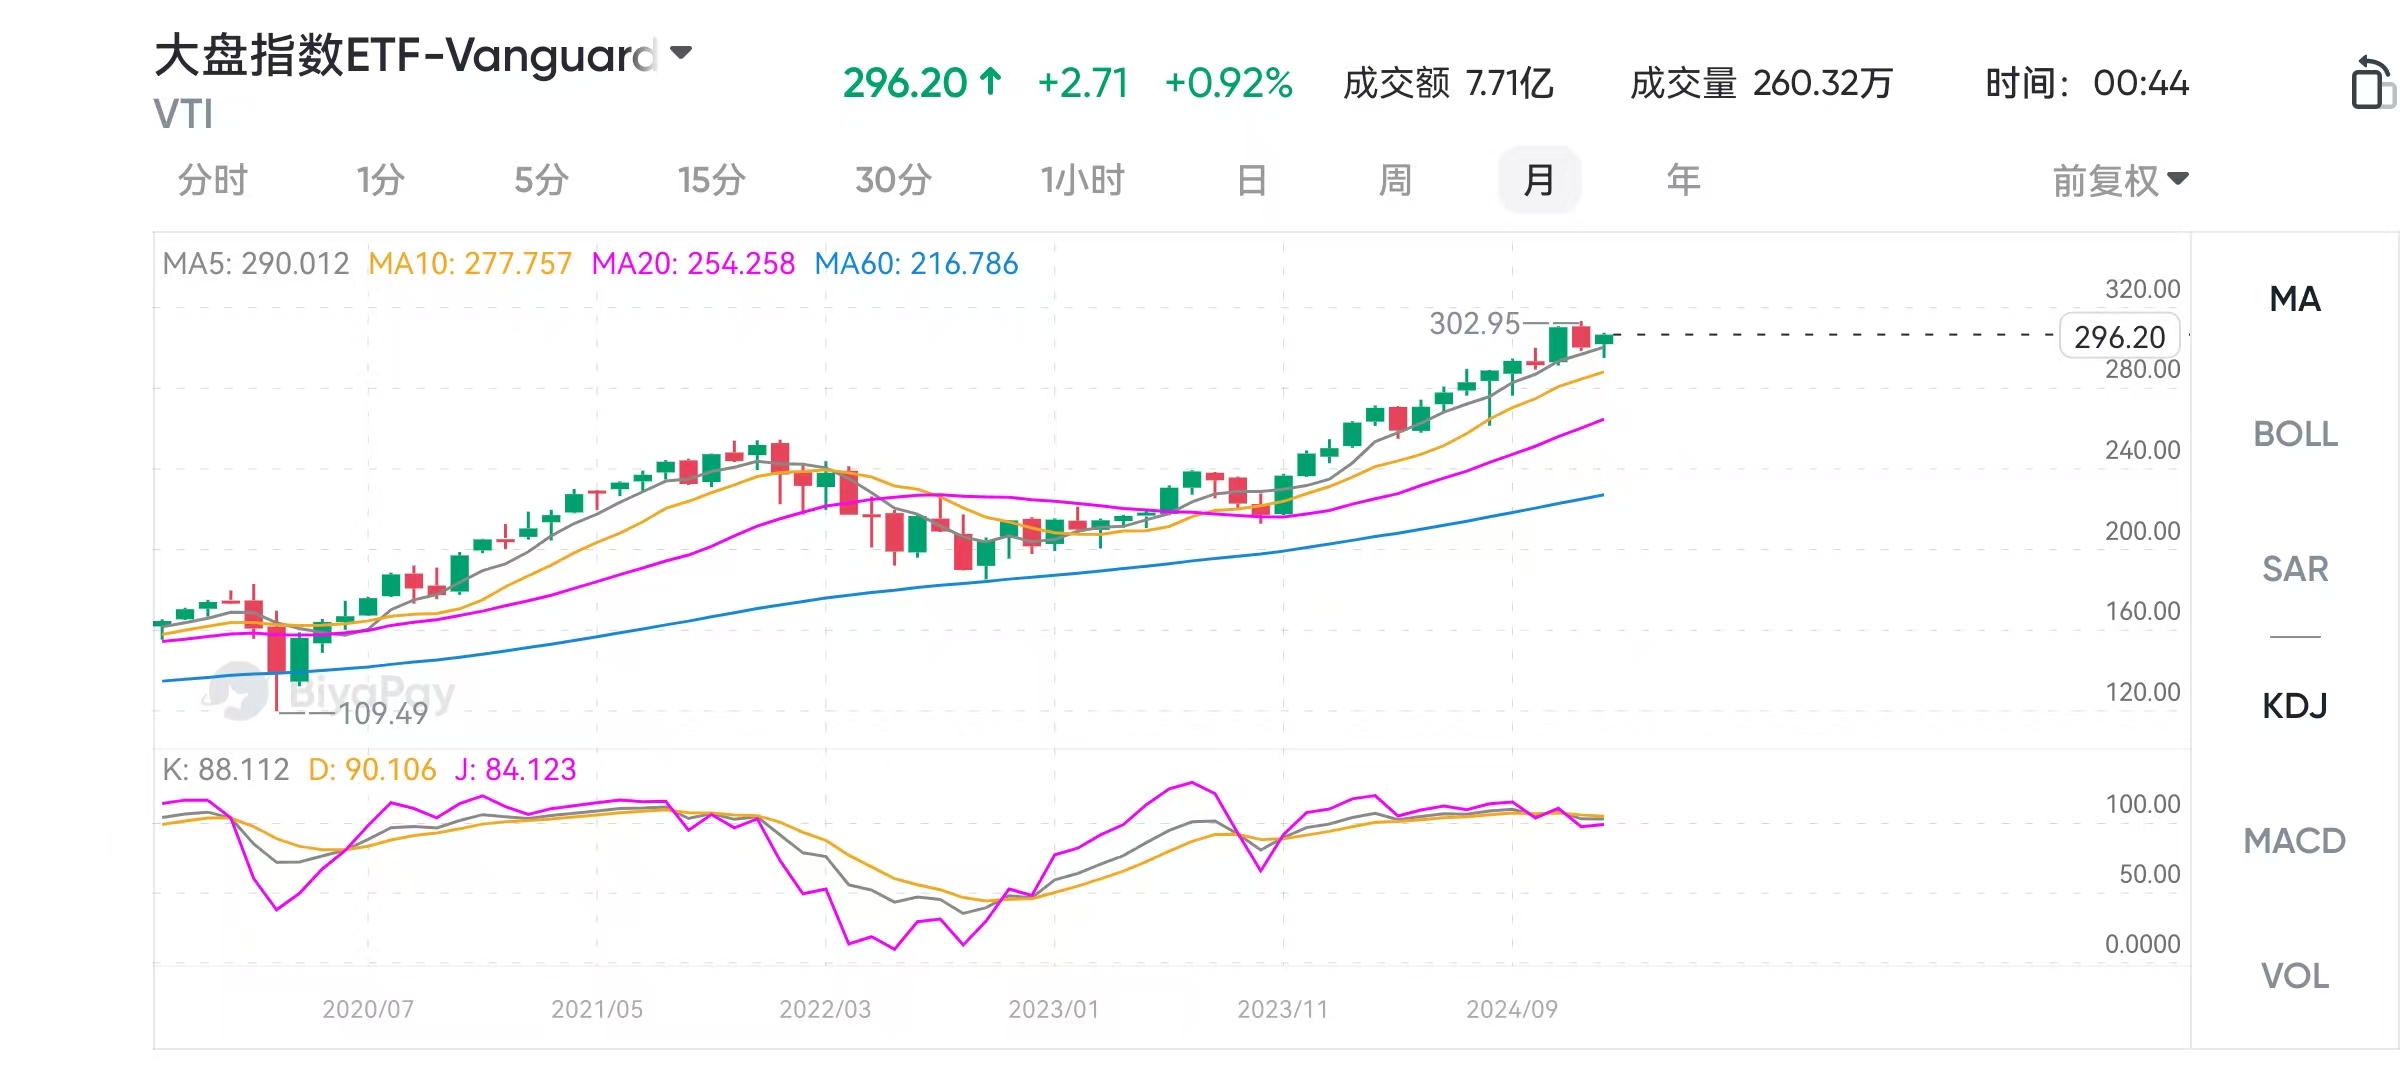
Although the investment targets are broad, its largest constituent stock is still Apple, which has the highest market value, accounting for 6.23%. Other companies with relatively high market values include Microsoft at 6.17%, Amazon at 3.04%, Nvidia at 2.35%, and Google at 1.81%.
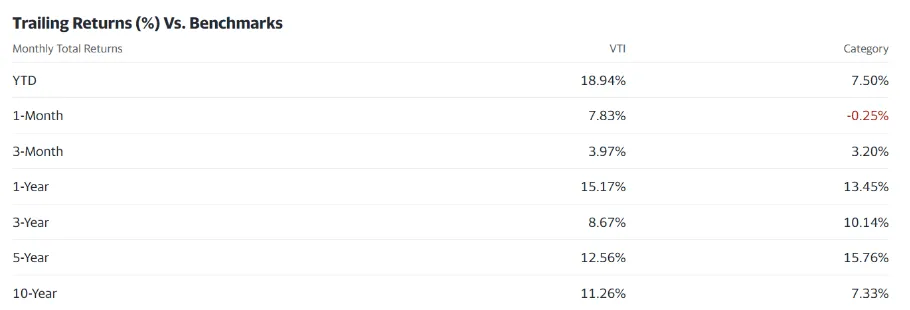
From the perspective of return, the 5-year return of VTI is 12.56%, while the average return of 10 years is 11.26%, which also means that the 5-year return of VTI is higher than the 10-year return. In addition, like VOO, the cost of VTI is also an internal deduction fee of 0.03% per year.
6.SPDR Dow Jones Industrial Average ETF Trust(DIA)
Ranked sixth is the SPDR Dow Jones Industrial Average ETF Trust, with the code DIA. This ETF was established on January 14, 1998 and currently has assets of $267.80 billion. DIA tracks the Dow Jones Industrial Average, which is the top 30 most traded companies in the US.
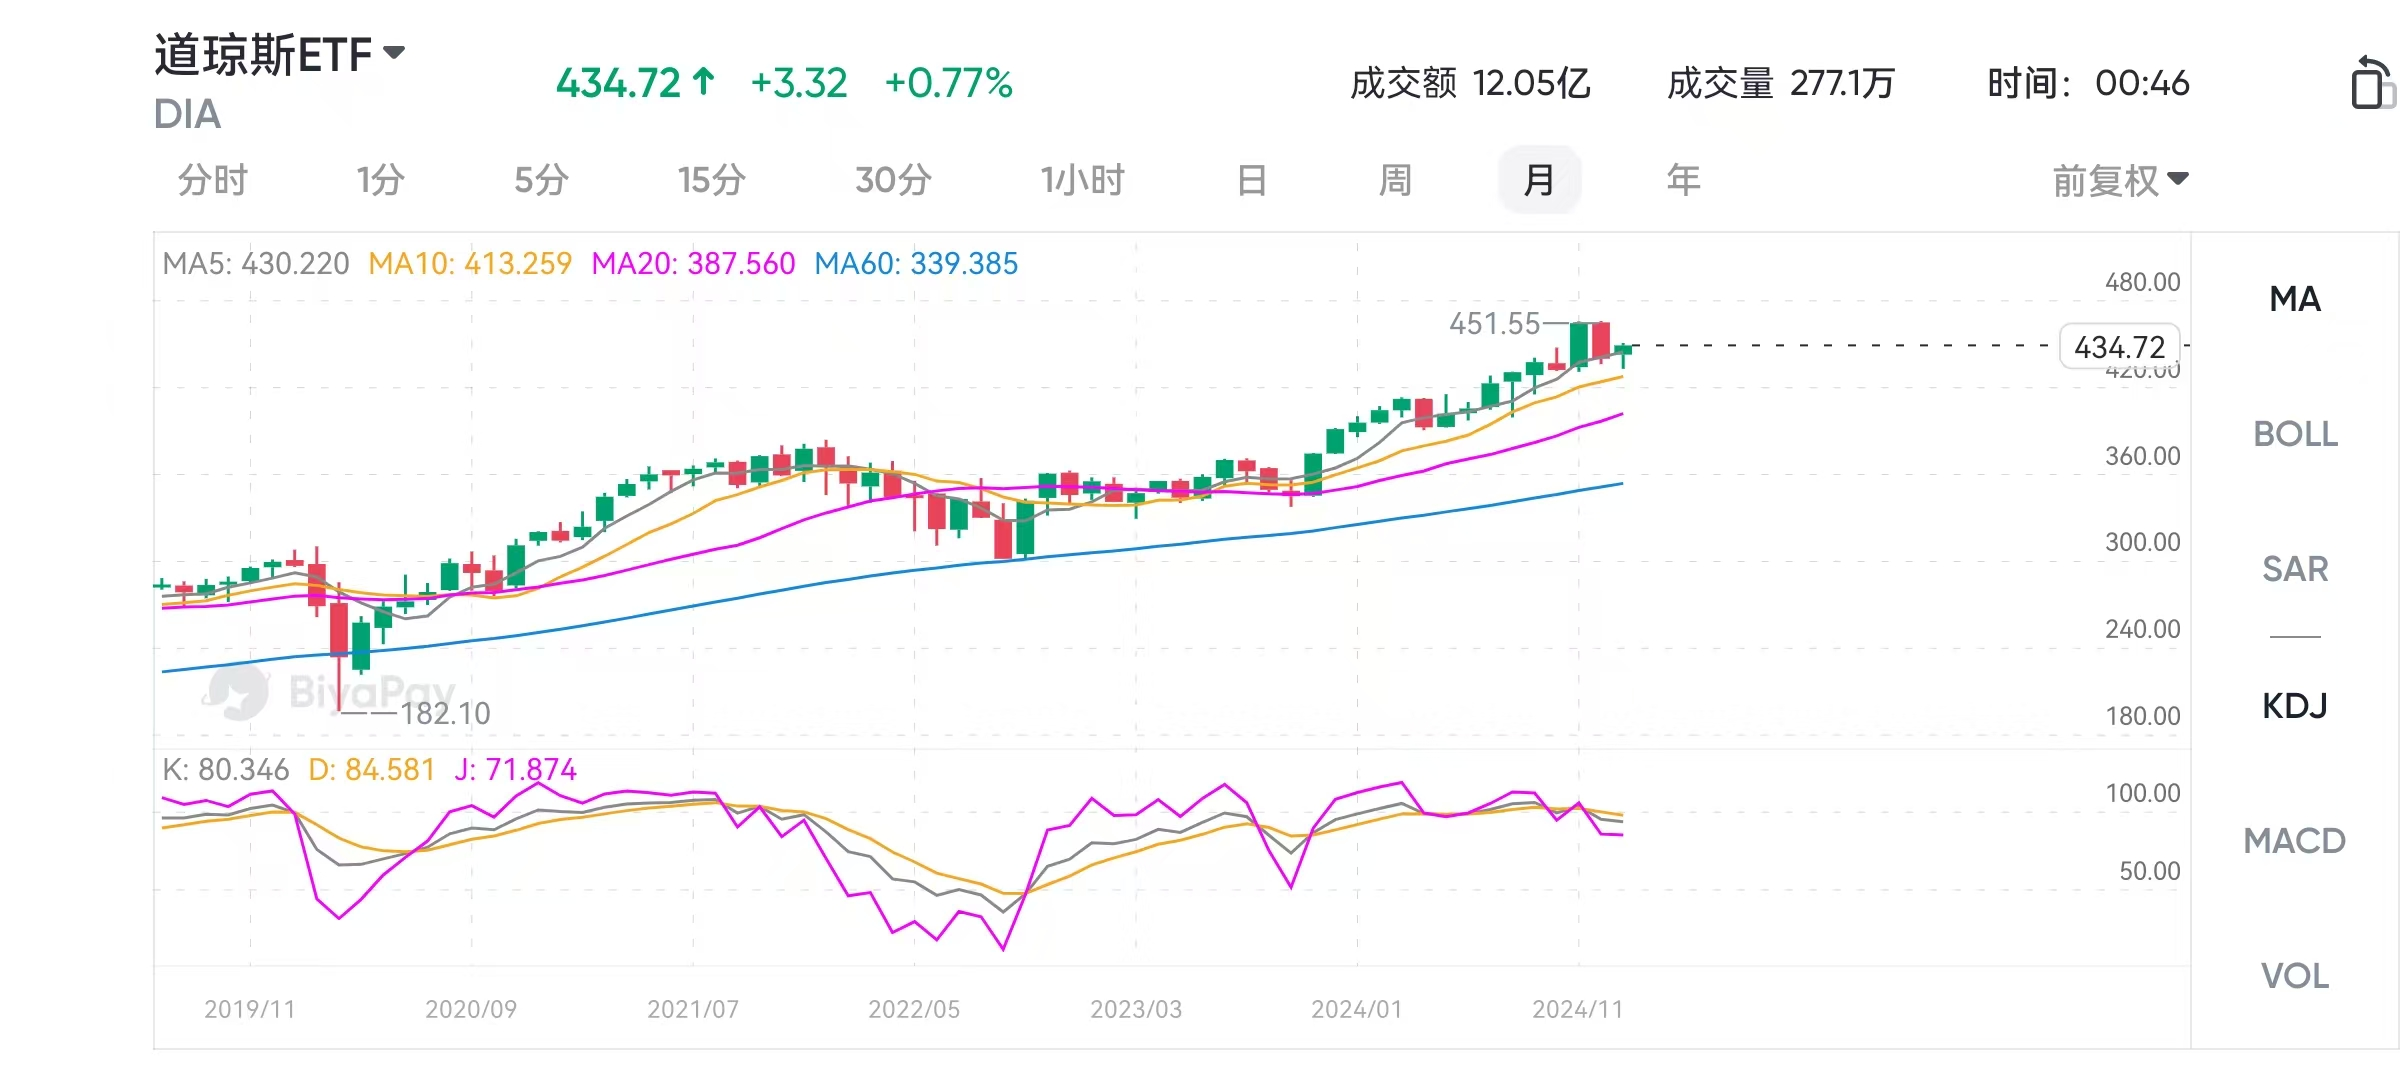
Among these 30 companies, the largest Constituent Stock is UnitedHealth, accounting for 10.03%. Other companies include Microsoft with 7.08%, Goldman Sachs with 6.36%, Home Depot with 5.78%, and McDonald’s with 5.23%.
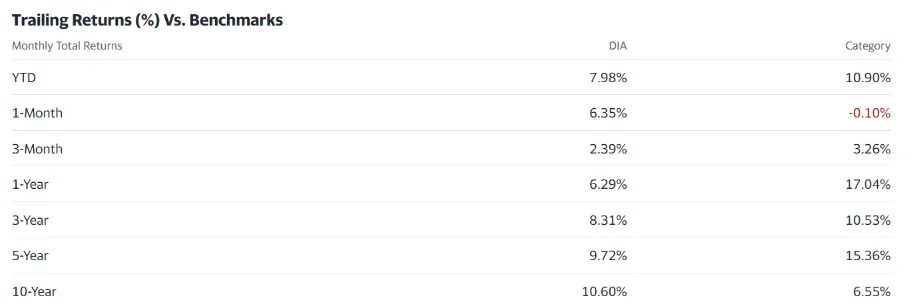
From the perspective of dividends, DIA’s return over 5 years is 9.72%, while the return over 10 years is 10.60%. This also proves that the return over 10 years will be higher than the return over 5 years. Finally, DIA’s annual internal deduction fee is 0.16%.
7.Vanguard Value Index Fund ETF(VTV)
Ranked seventh is the Vanguard Value Index Fund ETF, with the code VTV. VTV was established on January 26, 2004 and currently has assets of 139.39 billion. It tracks the CRSP US Large Cap Value Index, which is all large and medium-sized companies 2 billion 10 billion or more.
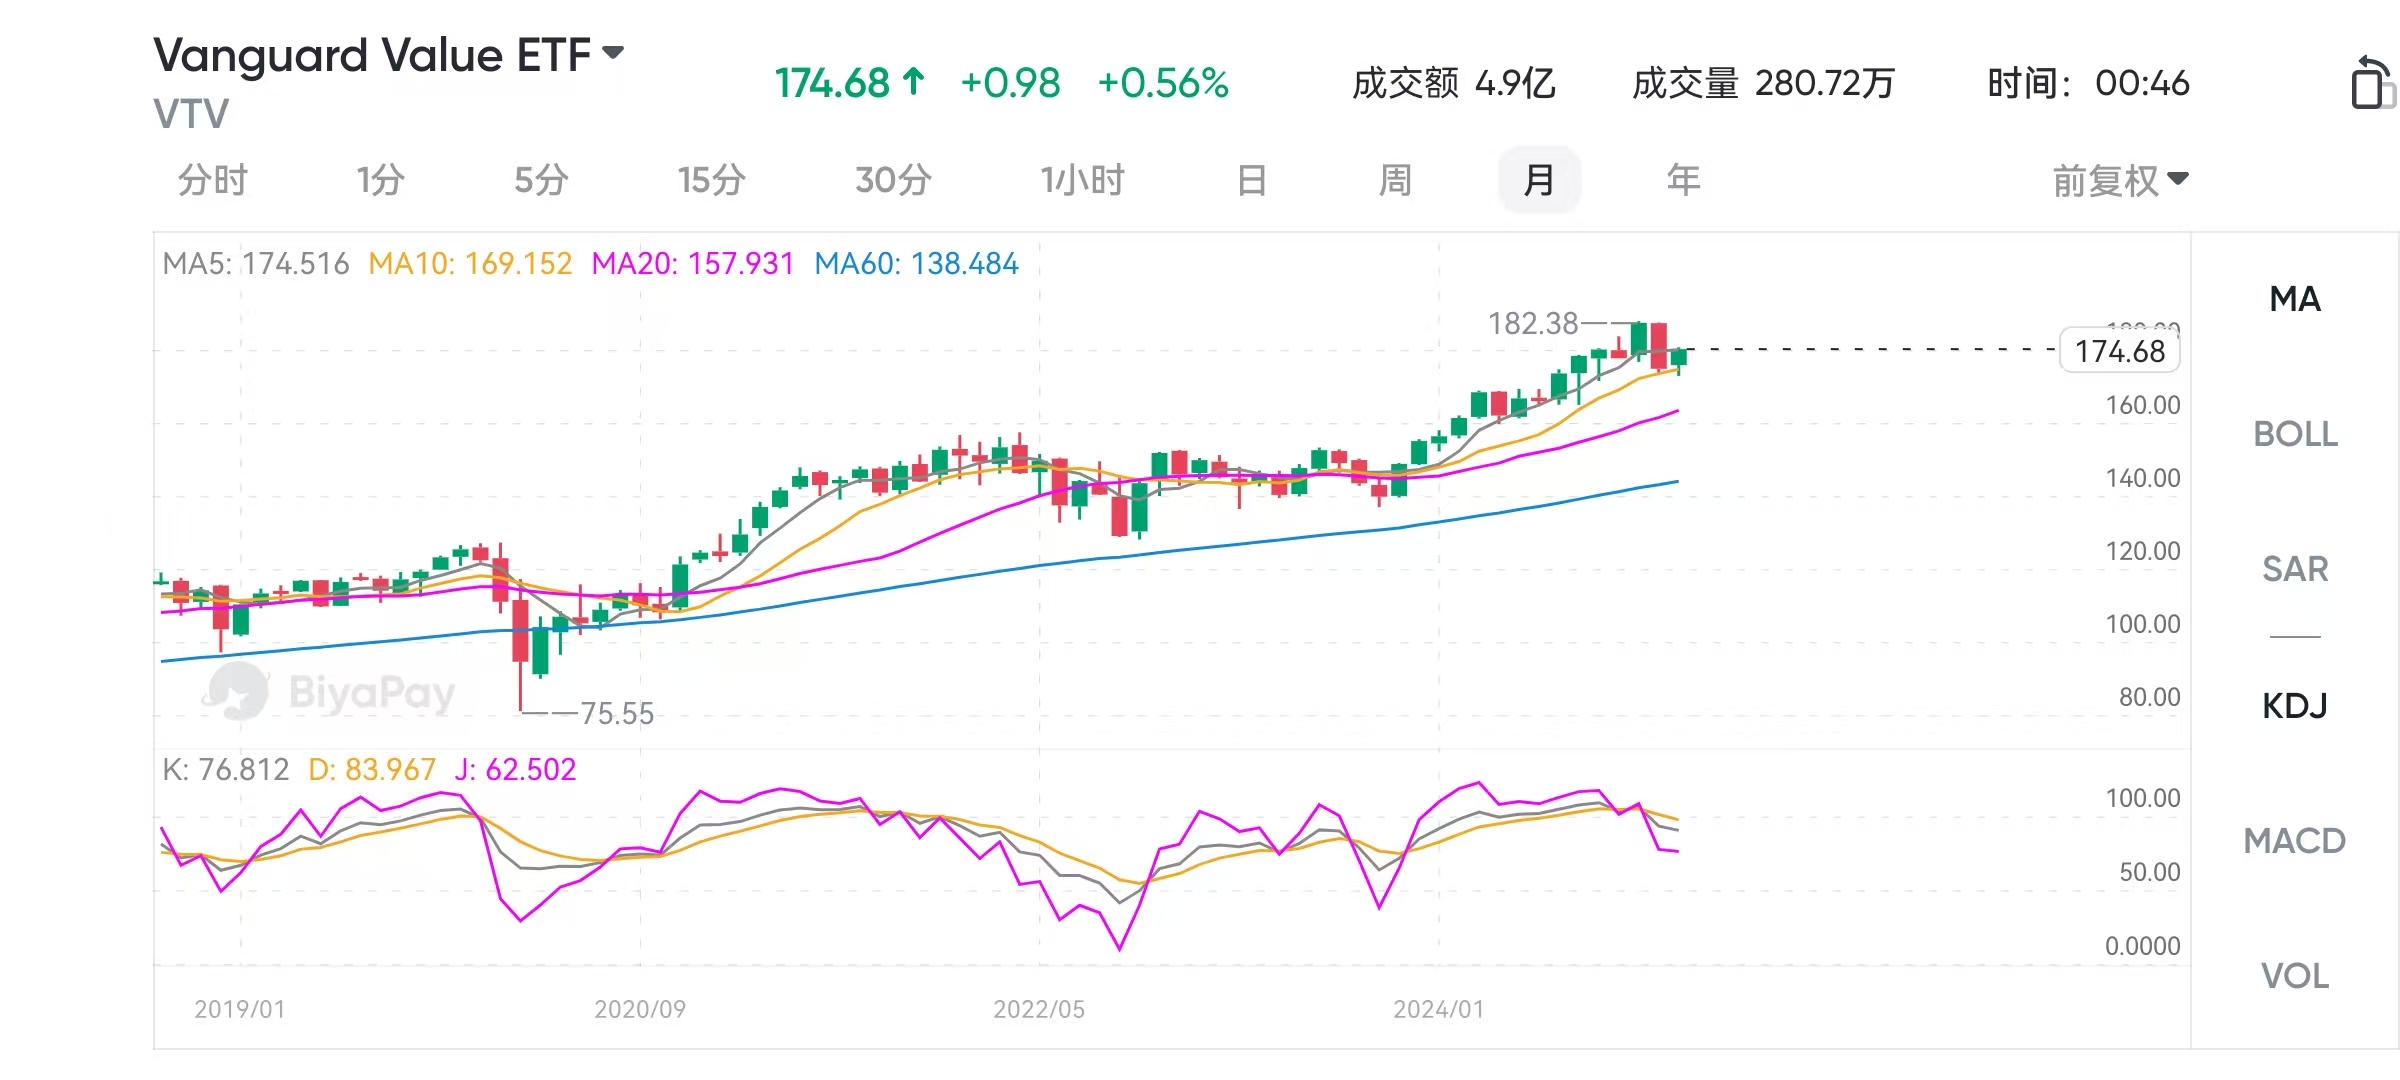
In addition, the largest Constituent Stock of VTV is Berkshire Hathaway, which currently accounts for 3.82%. Other relatively large Constituent Stocks include UnitedHealth at 3.04%, ExxonMobil at 2.60%, JPMorgan Chase at 2.48%, and Johnson & Johnson at 2.19%.
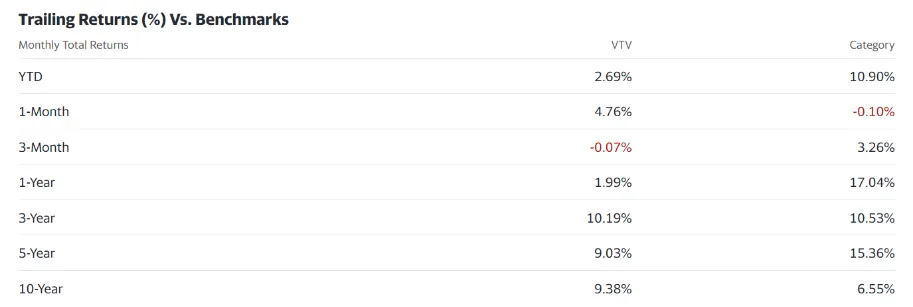
From the perspective of interest distribution, VTV’s 5-year return is 9.03%, while the 10-year return is 9.38%. This also means that the 10-year cycle return is higher than the 5-year cycle return of 1.64%. Finally, VTV will automatically deduct 0.04% from investment funds as internal deductions.
8.iShares Russell 1000 ETF(IWD)
Ranked eighth is the iShares Russell 1000 ETF, with the code IWD. The feature of this ETF is to track the Russell 1000 Index, which is the largest, medium, and small companies with the highest market value in the US. It is the second oldest company in the top ten and went public on January 1, 1984. Due to its extensive investment portfolio, its asset size is relatively high, currently reaching $466.40 billion.
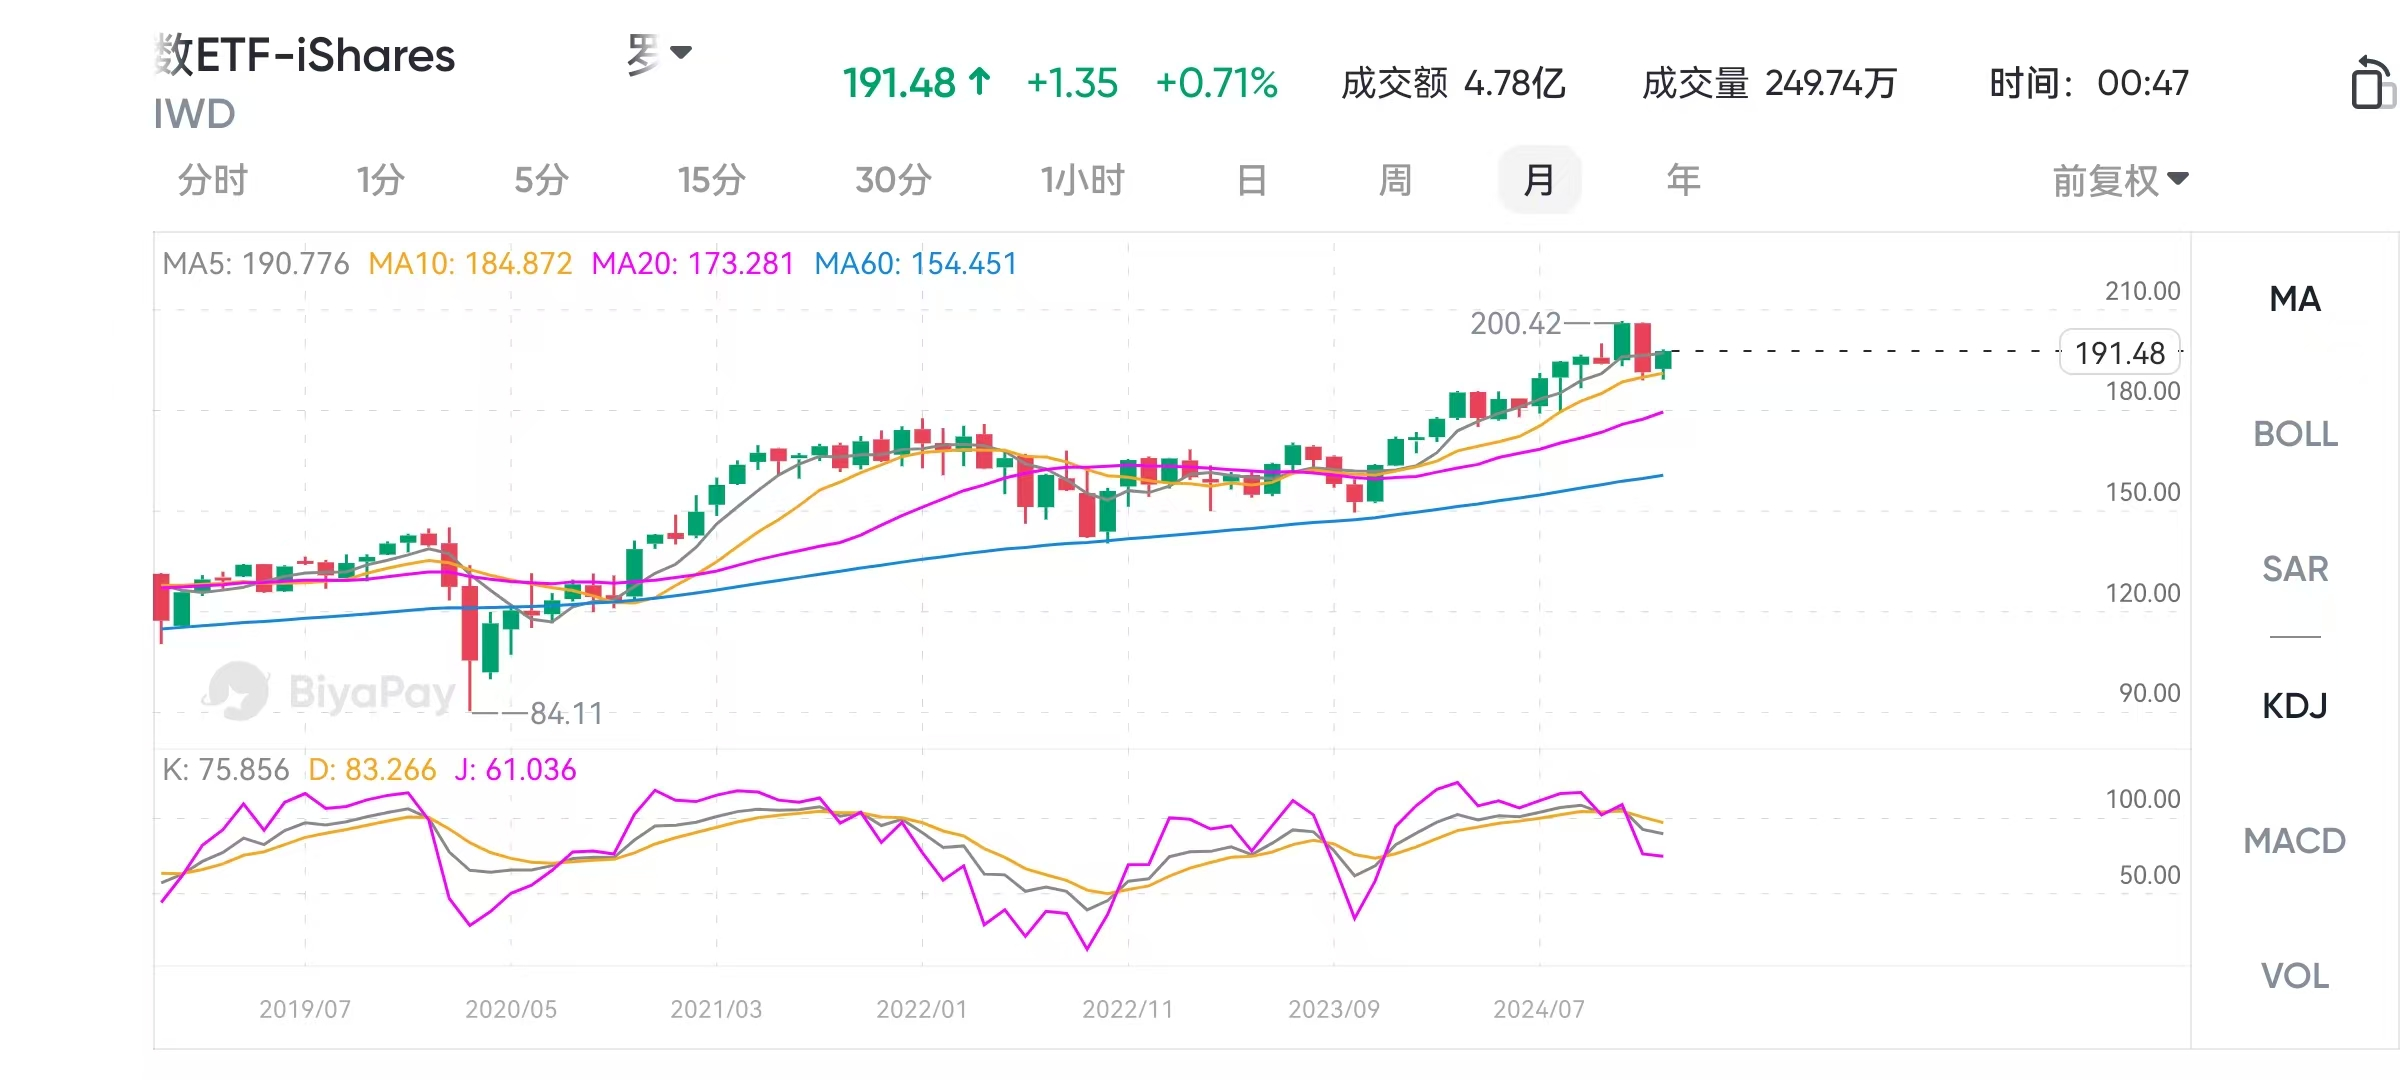
Among these 1000 companies, Buffett’s company, Berkshire Hathaway, has the highest proportion at 3.45%. Other companies with relatively high proportions include ExxonMobil at 2.52%, JPMorgan Chase at 2.24%, Johnson & Johnson at 2.00%, and Chevron Group at 1.59%.
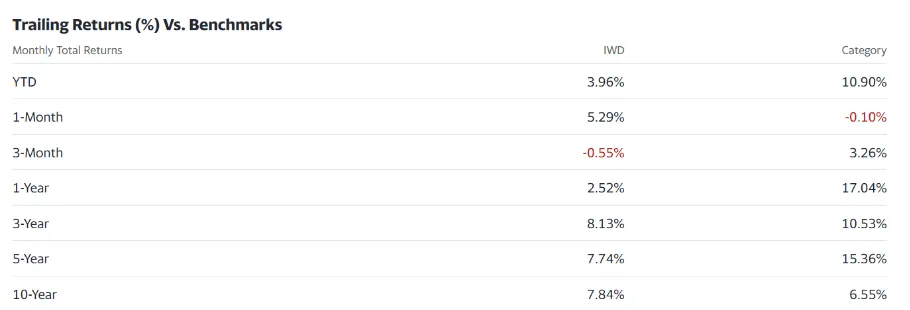
The average return of IWD over 5 years is 7.74%, and over 10 years it is 7.84%. From the perspective of dividends, it can be seen that the return on a 10-year cycle is 0.10% higher than that of a 5-year cycle. In addition, the cost of IWD is not high, only an annual deduction of 0.19%.
So how should we invest?
Let’s first take a look at how to choose the right platform for investment.
If you want to layout the above ETFs, you can use platforms like BiyaPay for Asset Allocation. With BiyaPay, you can quickly recharge digital currency and exchange it for US dollars or Hong Kong dollars, then conveniently withdraw it to your personal bank account and invest in other securities firms. The transfer speed is fast and there is no limit on the amount, making it easy for you to cross geographical restrictions and quickly enter the US stock ETF investment market.

In addition, BiyaPay also provides US stock investment services. You can directly search for the stock code of each US stock ETF on the BiyaPay platform to quickly complete the purchase.
How to choose the above 8 ETFs specifically?
In summary, each ETF has its own investment target, but it is most important to choose the one that suits our needs. Therefore, we can choose the ETF that best meets our needs based on the following analysis.
- Second (IVV), Third (VOO) and Fourth (SPY)
These three S & P 500 ETFs are ideal for investors who want to participate in the US large-cap stock index market, as SPY, VOO, and IVV basically track companies with market capitalization of 10 billion or more and are recognized as the best.
In addition to having the lowest internal deduction fees, their asset size is also one of the three highest among many S & P 500 ETFs. This also represents their high liquidity, as many people use them to participate in the US market.
- Fifth place (VTI), eighth place (IWD)
These ETFs track a more comprehensive market situation. For example, IWD tracks thousands of companies with different market values, so their performance is relatively stable. VTI tracks the overall economy of the US, so it includes a wider range of investment targets and involves all areas of the US.
These ETFs are more suitable for investors who want a more diversified investment portfolio. They are also suitable for investors who are optimistic about the overall development of large, medium and small enterprises in the US.
- First place (QQQ)
This type of ETF focuses on a specific field. For example, QQQ invests in technology companies, while BND invests in bonds of the US government and large companies. These ETFs are suitable for investors who want to participate in the US market but only have confidence in a certain field.
- Sixth place (DIA) and seventh place (VTV)
DIA and VTV invest in ETFs based on company assets or market value. For example, DIA invests in 30 well-known companies in the US. Although it covers a wide range, it invests in high-value companies to ensure their continuous growth. In addition, VTV invests in large and medium-sized enterprises with at least $2 billion in the US. This type of ETF is very suitable for investors who believe in the stability of large enterprises.
Finally, when investing in any ETF, be cautious and wish everyone to get rich soon!
*This article is provided for general information purposes and does not constitute legal, tax or other professional advice from BiyaPay or its subsidiaries and its affiliates, and it is not intended as a substitute for obtaining advice from a financial advisor or any other professional.
We make no representations, warranties or warranties, express or implied, as to the accuracy, completeness or timeliness of the contents of this publication.


Contact Us
Company and Team
BiyaPay Products
Customer Services


is a broker-dealer registered with the U.S. Securities and Exchange Commission (SEC) (No.: 802-127417), member of the Financial Industry Regulatory Authority (FINRA) (CRD: 325027), member of the Securities Investor Protection Corporation (SIPC), and regulated by FINRA and SEC.
registered with the US Financial Crimes Enforcement Network (FinCEN), as a Money Services Business (MSB), registration number: 31000218637349, and regulated by FinCEN.
registered as Financial Service Provider (FSP number: FSP1007221) in New Zealand, and is a member of the Financial Dispute Resolution Scheme, a New Zealand independent dispute resolution service provider.