In-Depth Analysis of US GDP: Comprehensive Insights from Consumption to Investment


Image Source: pexels
When the latest GDP data is released, do investors see just a number, or a roadmap concerning the future of their investment portfolios? This core US finance indicator is not only the thermometer of the economy but also a compass guiding asset allocation. The latest economic data shows strong growth momentum:
- The US economy grew at an annualized rate of 3.8% in the second quarter of 2025.
- This figure is higher than the second estimate of 3.3%.
- This is the strongest performance since the third quarter of 2023.
- The growth is mainly due to upward revisions in consumer spending and fixed investment.
Understanding the deeper implications behind these data can help investors turn them into practical investment advantages.
Key Points
- GDP is an important indicator for measuring national economic health, and investors need to understand it to make informed investment decisions.
- GDP consists of four parts: consumption, investment, government spending, and net exports, each providing unique investment signals.
- Investors can judge economic cycles based on GDP data and allocate to stocks during growth periods and shift to bonds and safe-haven assets during recessions.
- GDP data is released in three stages; investors should comprehensively consider the advance, second, and final estimates, and combine them with inflation and employment data for a full analysis.
US Finance Core: Why Is GDP a Must-Learn for Investors?
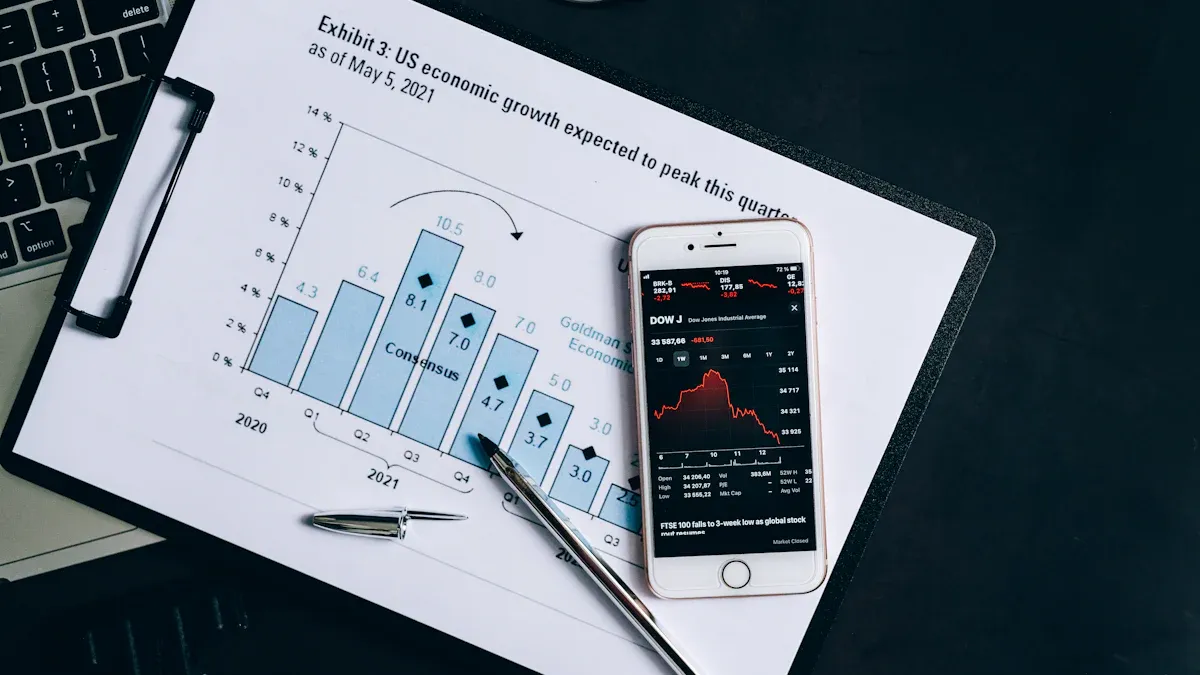
Image Source: pexels
Gross Domestic Product (GDP) is one of the most important indicators in the US finance field. It is not just an abstract economic concept but a foundational tool for investors to understand market dynamics and make informed decisions. Mastering the connotation of GDP can help investors see the full picture of the economy.
GDP Definition: Measuring the Pulse of Economic Activity
GDP measures the total market value of all final goods and services produced in a country during a specific period. Simply put, it is the core indicator measuring the scale and health of economic activity. A growing GDP usually means increased corporate profits, a positive job market, and sufficient consumer confidence. Conversely, a shrinking GDP may signal the risk of economic recession.
Global Impact: From the Dollar to Global Capital Flows
As the world’s largest economy, US GDP data has far-reaching impacts on global markets. Strong US GDP growth boosts investor confidence in the dollar, attracting global capital inflows to the US market in search of higher returns. This process directly affects foreign exchange rates, commodity prices, and the allocation direction of global capital. Therefore, paying attention to US GDP is a necessary step to understand global macroeconomic and US finance trends.
Investment Significance: Judging Economic Cycles and Market Directions
For investors, the most important role of GDP is to help judge the current stage of the economic cycle and adjust asset allocation accordingly. Economic cycles are usually divided into stages such as expansion, peak, and recession, with different assets performing differently in each stage.
Economic Cycles and Asset Performance
- Economic Expansion Period: GDP grows steadily, and corporate profits improve. At this time, stocks, real estate, and other growth assets usually perform well.
- Economic Peak Period: Growth slows, and inflationary pressures emerge. Investors should consider gradually shifting to more defensive assets.
- Economic Recession Period: GDP shows negative growth, and market risk aversion rises. Government bonds, gold, and other safe-haven assets become significantly more attractive, while risky assets like stocks face greater pressure.
By interpreting GDP data, investors can more accurately judge market directions and make more forward-looking investment decisions in different cycles.
Breaking Down US GDP: Investment Signals from the Four Engines

Image Source: pexels
The overall GDP figure is important, but its internal composition reveals more about the true drivers and potential risks of the economy. GDP is driven by four engines: personal consumption expenditures (PCE), private domestic investment (I), government spending (G), and net exports (NX). In-depth analysis of these four parts allows investors to discover “barometers” for specific industries and capture precise investment signals.
Consumption (PCE): Economic Cornerstone and Consumer Stock Trends
Personal consumption expenditures (PCE) are the absolute cornerstone of the US economy, usually accounting for nearly 70% of total GDP. It reflects household spending on goods and services and is the most direct indicator of consumer confidence and purchasing power. Therefore, the trend in consumption data directly determines the prospects for consumer stocks in retail, dining, tourism, and entertainment.
Recent data shows subtle changes in consumption structure. During the pandemic, consumers shifted spending focus from services to durable goods. However, this trend is reversing. Data shows that durable goods spending has shown a “payback effect” recently after earlier surges, meaning early overconsumption led to recent demand weakness.
| Time | Personal Consumption Expenditures on Durable Goods (Billions of Dollars, Seasonally Adjusted Annual Rate) |
|---|---|
| September 2025 | 2,264.9 |
| August 2025 | 2,279.9 |
| July 2025 | 2,280.1 |
| June 2025 | 2,253.6 |
| May 2025 | 2,247.0 |
Investment Insights Structural changes in consumption data provide clear guidance for investors. When services spending continues to grow while durable goods spending slows, investors should focus on service companies like airlines, hotels, and restaurants. Conversely, if goods consumption regains momentum, it benefits automakers, appliance brands, and large retailers.
Investment (I): Corporate Confidence and Industry Prosperity
Private domestic investment (I) includes corporate investments in equipment, software, construction, and residential investment in the real estate market. This indicator is a “barometer” measuring corporate confidence. When enterprises are optimistic about future economic prospects, they increase capital expenditures and expand production. Such investment activities not only directly drive economic growth but also signal improved prosperity in related industries.
According to Federal Reserve data, in January 2024, the US real private domestic gross investment change rate from the previous period was 4.00000%, showing recovery in corporate investment willingness. The latest quarterly data further confirms this trend.
| Indicator | 2025 Q2 |
|---|---|
| Real Investment (Millions of 2017 Dollars, Seasonally Adjusted Annual Rate) | 4,382,819 |
| Quarterly Growth Rate | 3.63 % |
Among all investment categories, technology industry investment is particularly noteworthy. Corporate investments in artificial intelligence, cloud computing, and automation directly drive strong performance in tech stocks.
- In the first half of 2023, tech stocks contributed 76.2% to the overall performance of the Nasdaq 100 Index.
- As of June 30, 2023, the technology sector weighted 61.5% in the Nasdaq 100 Index.
- Integration of artificial intelligence technology is thoroughly transforming various industries, highlighting the strong growth potential of the technology sector in the future.
For investors, tracking private investment data, especially capital expenditures in high-tech fields, is key to discovering growth stocks and grasping industry rotation opportunities.
Government Spending (G): Policy-Driven and Related Sector Opportunities
Government spending (G) covers federal, state, and local government expenditures on defense, infrastructure, education, and healthcare. Unlike consumption and investment influenced by market sentiment, government spending is mainly policy-driven, thus highly predictable. This provides investors with a unique “top-down” analysis perspective.
US government spending plays an important role in the economy. According to International Monetary Fund data, US total government spending reached 9.372 trillion USD in 2022, accounting for 36.7% of GDP. Analysts expect this proportion to further rise to 40.50% by the end of 2025.
Policy-Created Investment Opportunities The recently passed “One Big Beautiful Bill Act” (OBBBA) is a typical example. The bill plans to significantly increase defense spending in fiscal year 2026, expected to push total defense spending over 1 trillion USD. These funds will be precisely directed to specific areas, bringing direct orders to related listed companies.
Investors can focus on the following key areas benefiting from government spending:
- Defense and Aviation: The bill allocates over 29 billion USD for shipbuilding, 4.5 billion USD for procuring B-21 next-generation bombers, and substantially increases funding for missile defense systems.
- Nuclear Energy and Security: Over 10.8 billion USD for capital restructuring of the US nuclear arsenal, with additional funds for the National Nuclear Security Administration (NNSA) to accelerate domestic uranium production and facility modernization.
- Space Technology: 3.65 billion USD allocated to support military satellite procurement and protection, directly benefiting related satellite technology and aerospace companies.
By interpreting government budgets and bills, investors can position in advance in these policy-driven sectors with higher certainty.
Net Exports (NX): Global Trade and Currency-Stock Linkage
Net exports (NX) equal a country’s total exports minus total imports. When exports exceed imports, there is a trade surplus; otherwise, a trade deficit. This indicator not only reflects the competitiveness of US products in global markets but also profoundly affects dollar exchange rates and stock prices of multinational companies.
The United States has long been in a trade deficit state, mainly driven by goods trade, while usually maintaining a surplus in services trade. In August 2025, the US goods and services trade deficit narrowed to 59.6 billion USD, showing improvement in trade conditions.
Changes in trade policies, such as tariff increases or reductions, have immediate impacts on market sentiment and corporate valuations. Studies show that during the US-China trade friction period, tariff announcements led to cumulative declines of 11.5% in the US stock market on announcement days, with company equity value losses reaching up to 4.1 trillion USD. This reflects investor pessimism about future corporate profits and increased uncertainty.
For investors holding stocks in large multinational companies like Apple, Boeing, and Caterpillar, paying attention to net export data and trade policy trends is crucial. A strengthening dollar or new trade barriers may weaken these companies’ overseas profitability, thereby pressuring their stock prices. Therefore, incorporating net export data into the US finance analysis framework is necessary for global asset allocation.
Formulating Strategies: How to Use GDP Data for Investing?
Understanding GDP composition is the first step; turning these insights into actual investment strategies is the ultimate goal. Investors can dynamically adjust asset allocation based on economic cycles reflected in GDP data, thereby taking the initiative in different market environments.
Growth Period Strategy: Allocating to Stocks and Growth Assets
When GDP data shows the economy is in a steady growth period, corporate profit expectations improve, and market risk appetite rises. This is an excellent time to increase allocation to growth assets.
- Focus Industries: Historical data shows that specific industries perform particularly well during economic expansion. For example, in the third quarter of 2025, technology, non-essential consumer goods, and communication services outperformed the S&P 500 Index, achieving 11.3%, 10.3%, and 9.1% growth respectively. The three technology-dominated industries—information technology, communication services, and non-essential consumer goods—jointly contributed over 75% of total profit growth. This indicates the economic system has systematically shifted toward favoring knowledge-based industries.
- Asset Allocation Ideas: Investors should consider allocating a higher proportion of funds to stocks, particularly the aforementioned growth sectors. Reduce holdings in cash and low-yield bonds to capture higher capital appreciation potential.
Practical Operation Tips Investors can use digital asset platforms like Biyapay to conveniently allocate funds to ETFs tracking the Nasdaq 100 Index or S&P 500 information technology sector, thereby one-click positioning in high-growth potential tech stock combinations.
Recession Period Strategy: Shifting to Bonds and Safe-Haven Assets
When GDP growth slows or even shows negative growth, the economy enters a recession period. At this time, corporate profits decline, market uncertainty surges, and the core of investment strategy should shift to risk aversion and capital preservation.
- Increase Safe-Haven Assets: Government bonds and gold are the classic safe-haven tools during recessions. Historical data shows their performance far exceeds risky assets during economic downturns.
| Recession Period | Bloomberg US Long Treasury Index Return | S&P 500 Index Return |
|---|---|---|
| March 24, 2000 - October 9, 2002 | +38% | -47% |
| October 9, 2007 - March 9, 2009 | +21% | -55% |
| February 19, 2020 - March 23, 2020 | +13% | -34% |
- Unique Value of Gold: Since 1971, gold has outperformed other precious metals during almost all US economic recessions. This is mainly due to its monetary attributes and sensitivity to central bank easing policies. The Fed usually cuts rates during recessions, lowering the opportunity cost of holding gold and thus pushing up its price. Gold has low correlation with stocks and bonds, making it an ideal tool for diversifying portfolio risk.
- Position in Defensive Stocks: Even during recessions, certain stock sectors remain resilient.
- Consumer Staples: Regardless of economic conditions, people need to buy food, beverages, and cleaning products, providing stable revenue for related companies.
- Utilities: Electricity, water, and natural gas are essentials of modern life; utility companies thus have reliable cash flows, making their stocks more defensive in market storms.
When recession signals appear, investors can use platforms like Biyapay to convert part of stock assets into gold or USD-pegged stablecoins while increasing holdings in defensive industry ETFs to build a more resilient portfolio.
Interpreting Reports: Different Meanings of Advance, Second, and Final Estimates
GDP data released by the Bureau of Economic Analysis (BEA) is not final but published in three stages: advance estimate, second estimate, and final estimate. Understanding the differences between them is crucial for accurately judging economic trends.
- Advance Estimate (Preliminary Estimate): Released in the first month after the quarter ends, based on incomplete early data, thus receiving the highest market attention and causing the largest fluctuations.
- Second Estimate: Released in the second month after the quarter ends, incorporating more comprehensive data.
- Final Estimate (Third Estimate): Released in the third month after the quarter ends, based on the most complete data.
Usually, GDP revisions are small. For example, from 1992 to 2019, the median GDP revision was only 0.3 percentage points. However, during economic turbulence, revisions can be very large. The actual GDP growth rate in the second quarter of 2025 was upward revised from 3.3% to annualized 3.8% in the final estimate, showing the economy was stronger than initially estimated.
Professional Investor Perspective Institutional investors usually have more professional models to digest economic reports. They actively trade on advance estimate releases, profiting from the market’s initial overreactions, and rebalance cross-asset portfolios after second and final estimates based on data changes. Retail investors should recognize the uncertainty of advance estimates and avoid impulsive decisions based on single data.
Comprehensive Decision-Making: Judging in Combination with CPI and Employment Data
GDP is the core of macroeconomic analysis but not the only indicator. A mature investor must combine GDP with inflation (CPI) and employment data to form a three-dimensional market judgment. These three major data together form the cornerstone of the Federal Reserve’s monetary policy formulation, profoundly affecting all asset prices.
The Fed considers comprehensively in decision-making:
- GDP: Assesses overall economic growth health.
- CPI/PCE: Measures inflation levels to judge price stability.
- Employment Data: Observes labor market tightness to judge if the economy is overheating or cooling.
A classic decision model is the Taylor Rule, which provides a quantitative framework for how the Fed sets rates based on inflation and output gap (difference between actual and potential GDP).
i_{t}=\pi _{t}+r_{t}^{*}+a_{\pi }(\pi _{t}-\pi _{t}^{*})+a_{y}\cdot 100(Y_{t}-{\bar {Y}}_{t})/{\bar {Y}}_{t}.This formula indicates that when inflation exceeds the target or economic output exceeds potential, the rule suggests raising rates, and vice versa. This explains why strong GDP and high CPI often trigger market concerns about rate hikes.
Investors should closely monitor predictions from major institutions on US finance indicators to form forward-looking judgments.
| Institution | Indicator | 2025 | 2026 |
|---|---|---|---|
| Deloitte (Baseline) | Real GDP Growth | 1.8% | 1.4% |
| EY-Parthenon | GDP Growth | Approximately 2.0% | 1.9% |
| Philadelphia Fed (Median) | Real GDP Growth Rate | 1.9% | 1.8% |
| Philadelphia Fed (Median) | Unemployment Rate | 4.2% | 4.5% |
By comprehensively analyzing GDP, CPI, and employment data, and understanding how they affect the Fed’s policy path, investors can truly strategize and make wiser decisions in complex market environments.
Mastering GDP and its components is the cornerstone for investors to build an analysis framework, not just viewing an isolated data point. Investors should actively analyze each data release and assess its potential impact on portfolios. Looking ahead, understanding complex factors like Fed rate cut expectations and real estate market resistance is crucial for global asset allocation.
Internalizing GDP analysis into investment intuition allows seizing the initiative in volatile markets.
FAQ
What kind of GDP growth rate is healthy?
Developed economies generally consider an annualized GDP growth rate of 2% to 3% as healthy. Excessively high growth may trigger inflation concerns, while sustained growth below this range may signal insufficient economic vitality. Investors can use this range as a benchmark for assessing economic health.
How often should investors pay attention to GDP data?
GDP data is released quarterly. Investors should pay attention to each release, especially the advance report, as it has the greatest impact on market sentiment. However, note that GDP is a lagging indicator and should be combined with other leading data for comprehensive judgment, avoiding sole reliance.
Why do stocks sometimes rise when GDP data is poor?
Stocks and GDP are not completely synchronized. Stocks are forward-looking indicators reflecting expectations for future corporate profits. GDP measures historical economic performance. Therefore, when the market expects economic recovery soon, stocks may rise ahead of weak GDP data.
What is the difference between real GDP and nominal GDP?
Core Difference Lies in Whether Inflation Is Excluded
- Nominal GDP: Calculated at current market prices, including price change impacts.
- Real GDP: Excludes inflation impacts, more truly reflecting actual economic output growth.
Investors should focus on real GDP because it more accurately measures the true health of the economy.
*This article is provided for general information purposes and does not constitute legal, tax or other professional advice from BiyaPay or its subsidiaries and its affiliates, and it is not intended as a substitute for obtaining advice from a financial advisor or any other professional.
We make no representations, warranties or warranties, express or implied, as to the accuracy, completeness or timeliness of the contents of this publication.
Related Blogs of

Master US Stock Trading Hours in One Article: Never Miss Pre-Market and After-Hours Opportunities


2025 Advanced Guide to US Stock Trading: What is Level 2 Data and Software Choices

A Blessing for Small Investors: Finding the Lowest Trading Cost US Stock Brokers


Must-Read for Investing in US Stocks in 2025: 5 Technical Indicator Tips for Analyzing Real-Time Quotes

Choose Country or Region to Read Local Blog

Contact Us


BIYA GLOBAL LLC is a licensed entity registered with the U.S. Securities and Exchange Commission (SEC No.: 802-127417); a certified member of the Financial Industry Regulatory Authority (FINRA) (Central Registration Depository CRD No.: 325027); regulated by the Financial Industry Regulatory Authority (FINRA) and the U.S. Securities and Exchange Commission (SEC).
BIYA GLOBAL LLC is registered with the Financial Crimes Enforcement Network (FinCEN), an agency under the U.S. Department of the Treasury, as a Money Services Business (MSB), with registration number 31000218637349, and regulated by the Financial Crimes Enforcement Network (FinCEN).
BIYA GLOBAL LIMITED is a registered Financial Service Provider (FSP) in New Zealand, with registration number FSP1007221, and is also a registered member of the Financial Services Complaints Limited (FSCL), an independent dispute resolution scheme in New Zealand.