Panning for Gold in the Stock Market: Penetrating the Fog with Gross Profit Margin to Lock in High - quality and Explosive Enterprises!


Image Source: unsplash
Do you often feel lost when picking stocks? Gross margin pierces the fog, helping you quickly identify high-quality and high-growth companies. Many investors focus on gross margin because it reflects a company’s multifaceted strengths:
- You can discover a company’s performance baseline through profit margin comparisons.
- Companies with high gross margins typically have strong cost control capabilities.
- Stable gross margins indicate that a company has robust financial stability.
- High gross margin companies are more likely to attract investors and have the potential for reinvestment and expansion.
By focusing on these metrics, you can efficiently screen out companies worthy of deeper research.
Key Points
- Gross margin is a critical metric for evaluating a company’s profitability, helping you quickly identify high-quality companies.
- High gross margins typically indicate strong cost control capabilities and financial stability.
- When selecting stocks, combining gross margin with other financial metrics, such as net profit margin and operating margin, provides a more comprehensive analysis.
- Industry comparison is key; gross margin levels are influenced by industry characteristics, and you cannot simply compare companies across different sectors.
- Be cautious of inflated gross margin risks, and analyze them rationally in the context of the company’s overall financial condition.
Gross Margin Basics

Image Source: pexels
Definition and Calculation
When analyzing companies, you often encounter the term “gross margin.” Gross margin is a key metric for measuring a company’s profitability. You can use it to understand how much revenue a company retains after deducting direct costs from selling products or services.
The table below summarizes the standard definition and calculation method of gross margin in financial analysis:
| Source | Definition | Calculation Method |
|---|---|---|
| Growfin | Gross margin measures a company’s production efficiency or ability to control direct production costs. | Subtract the cost of goods sold (COGS) from revenue, then divide that number by revenue, expressing the result as a percentage. |
| Fool | Gross margin is a measure of a company’s profitability, typically expressed as a percentage. | Gross profit (revenue minus cost of goods sold) divided by total revenue, resulting in a decimal ratio, multiplied by 100 to convert to a percentage. |
You can use this formula: Gross Margin = (Revenue - Cost of Goods Sold) / Revenue. The result is typically expressed as a percentage. By using gross margin to pierce the fog, you can more clearly see a company’s profitability structure and cost control capabilities.
Influencing Factors
When conducting actual analysis, you’ll find that gross margin is influenced by multiple factors. Here are common influencing factors:
- Industry: Different industries have varying cost structures and levels, leading to significant differences in gross margins. For example, the technology sector typically has higher gross margins, while the retail sector has lower ones.
- Region: The costs, expenses, and market environment of the region where a company operates affect gross margins.
- Business Type: E-commerce businesses often have lower indirect costs and higher sales potential, which may lead to higher gross margins.
- Market Competition: In highly competitive markets, companies may need to lower prices, squeezing gross margins.
- Sales Volume: Increased sales volume may boost revenue and gross profit but could also incur higher operational costs.
- Product Mix: If a company shifts to high-priced, high-margin products, its overall gross margin improves.
- Material and Labor Costs: Raw material and labor costs directly affect the cost of goods sold, thereby impacting gross margins.
- Shipping Costs: The cost of transporting products is also part of the cost of goods sold.
- Taxes and Regulations: Tax policies and compliance costs affect a company’s net profit margin.
When analyzing companies, you should consider these factors comprehensively to more accurately assess changes in gross margin and a company’s true profitability.
Gross Margin Pierces the Fog: Company Quality
Characteristics of High Gross Margin
When analyzing companies, you often notice that high gross margin companies exhibit distinct characteristics. These characteristics not only reflect a company’s profitability but also its market position. You can identify high gross margin companies through the following aspects:
- High gross margin companies typically demonstrate stronger financial performance, which is seen as a proxy for core competitiveness.
- Larger companies with stronger export capabilities and better past profitability often have higher gross margins.
- High gross margin companies tend to offer unique products or services, enabling differentiation in the market.
- These companies excel in cost control and pricing strategies, effectively managing production costs to increase profit margins.
- You’ll find that stable gross margins typically indicate that a company’s management team has a high level of expertise, maintaining operational efficiency.
- Consistent product quality and service enable companies to sustain high profit margins.
In actual analysis, you can use gross margin to pierce the fog, quickly screening out high-quality companies with sustained profitability and market competitiveness. Higher gross margins also indicate that a company earns more profit per dollar of sales, directly reflecting its operational efficiency and management capabilities.
Tip: If you find that a company’s gross margin is consistently above the industry average, it often means it has unique advantages in products, branding, or technology, making it worthy of further attention.
Competitive Advantage
In investment analysis, you often use gross margin to pierce the fog, determining whether a company has long-term competitive advantages. High gross margin companies typically have the following competitive advantages:
- Unique products or services that meet specific market demands, forming brand barriers.
- Low-cost procurement and efficient production, allowing companies to remain profitable in price wars.
- Stable product quality, leading to consistent profits and customer loyalty.
- Healthy profit margins enable companies to continuously invest in R&D, marketing, and employee development, further strengthening their market position.
- Strong revenue growth and low debt levels allow companies to withstand economic fluctuations and maintain long-term sustainable development.
You can use gross margin to pierce the fog, comparing the profitability of different companies in the same industry. Companies with high gross margins are often better at allocating resources and seizing market opportunities. You may also find that profit margin analysis can reveal the professionalism of a company’s management team. Stable gross margins indicate good management, while significant fluctuations may suggest operational issues.
- Gross margin is the percentage of profit a company retains after deducting costs from sales.
- Lower gross margins may indicate issues with cost control, affecting profitability.
When selecting stocks, you should combine gross margin with other financial metrics for a comprehensive analysis to better assess a company’s quality and growth potential. By using gross margin to pierce the fog, you can more clearly identify high-quality companies with core competitiveness and market leadership.
Stock Selection in Practice
Industry Comparison
When selecting stocks, you should first learn to compare gross margins across different industries. Each industry has different profit models and cost structures, leading to significant variations in gross margins. You cannot simply use one industry’s high gross margin to judge the quality of a company in another industry.
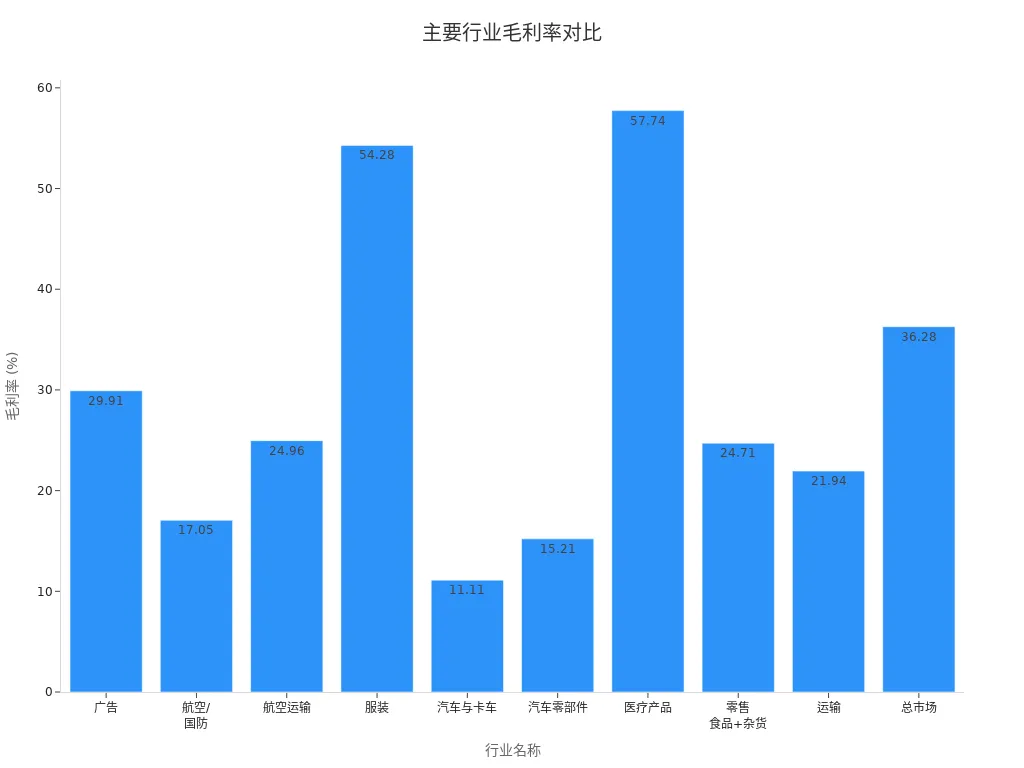
The table below shows the average gross margins of major industries in the U.S. stock market (in USD):
| Industry Name | Gross Margin |
|---|---|
| Advertising | 29.91% |
| Aerospace/Defense | 17.05% |
| Air Transport | 24.96% |
| Apparel | 54.28% |
| Auto & Truck | 11.11% |
| Auto Parts | 15.21% |
| Medical Products | 57.74% |
| Retail (Food + Grocery) | 24.71% |
| Transportation | 21.94% |
| Total Market | 36.28% |
You can see that the medical products and apparel industries have much higher gross margins than the auto industry. When analyzing, you should use the industry’s average gross margin as a benchmark to assess a target company’s profitability. If a company’s gross margin is above the industry average, it indicates advantages in cost control, product pricing, or market positioning.
You can also visually understand the distribution of gross margins across industries through the chart below:
In practice, you can compare a target company’s gross margin with the industry average. For example, if a company’s TTM gross margin is 71.72% while the industry average is 71.18%, the company has a slight edge in profitability. You can further compare operating margin and pre-tax profit margin to assess the company’s performance in operations and tax management.
Tip: When comparing industries, you should combine valuation metrics like the PEG ratio to avoid focusing solely on gross margin. A low PEG ratio often indicates an undervalued company, but PEG standards vary by company type and industry.
Historical Trends
When analyzing gross margins, you should not only look at current data but also focus on historical trends. Changes in gross margin can reflect shifts in a company’s operational condition.
You can analyze historical gross margin trends using the following methods:
- Observe the company’s gross margin data over the past few years to determine whether its profitability is stable or improving.
- If gross margins are rising year-over-year, it suggests progress in cost control, product upgrades, or market expansion.
- If gross margins fluctuate significantly, it may indicate issues like raw material price volatility, intensifying market competition, or declining management efficiency.
- You can use financial models to predict future gross margin trends, aiding in assessing a company’s growth potential.
You can also compare a target company’s gross margin trends with those of other companies in the same industry to identify potential investment opportunities. Gross margin pierces the fog, helping you identify companies with sustained profitability and growth potential.
Multidimensional Screening
When selecting stocks, you cannot rely solely on gross margin. You need to combine multiple financial metrics for a comprehensive screening. Commonly used metrics include:
- Net Profit Margin: Shows a company’s ultimate profitability, reflecting overall operational efficiency.
- Operating Margin: Measures the profitability of a company’s core business, excluding non-recurring factors.
- Return on Equity (ROE): Assesses a company’s ability to generate profits from shareholders’ funds.
- Return on Assets (ROA): Measures a company’s efficiency in using all its assets.
- Free Cash Flow (FCF): Reflects the cash a company can freely use, indicating financial health.
- Revenue Growth Rate: Assesses a company’s ability to expand its business and increase market share.
You can combine these metrics with gross margin to build your own multidimensional screening system. For example, you can prioritize companies with high gross margins, stable net profit margins, and sustained revenue growth. You can also use free cash flow to assess whether a company has the capacity for sustained expansion and risk resilience.
Suggestion: In practice, you should use tables or screening tools to compare a target company’s financial metrics with industry averages, quickly locking in high-quality and high-growth companies.
Through industry comparisons, historical trend analysis, and multidimensional screening, you can make more scientific stock selection decisions. Gross margin pierces the fog, helping you find companies with true core competitiveness in a complex market environment.
Case Studies

Image Source: pexels
Industry Leaders
When analyzing industry-leading companies, you can use gross margin to pierce the fog, quickly identifying those with true core competitiveness. Industry leaders typically have gross margins above the industry average, reflecting their advantages in cost control, pricing power, and market position. You can analyze industry leaders using gross margin in the following ways:
- Compare a company’s gross margin with industry benchmarks to identify which companies are in leading positions.
- Optimize pricing strategies to improve gross margins and enhance a company’s market competitiveness.
- Evaluate operational and production costs to identify companies with high management efficiency and strong profitability.
In practice, you can screen for companies with gross margins consistently above the industry average through horizontal comparisons. These companies often have stable customer bases, strong brand influence, and sustained innovation capabilities.
High-Growth Companies
When searching for high-growth companies, gross margin analysis is equally critical. High-growth companies typically exhibit the following characteristics:
- High revenue growth rates, far exceeding industry averages.
- Strong market position or potential, able to secure significant positions through innovation and brand differentiation.
- Continuous technological advancements, driving product and service upgrades.
- Scalable business models that can rapidly expand without significantly increasing costs.
- Ability to secure expansion capital, attracting substantial investments to support growth.
You can combine gross margin and revenue growth metrics to screen for companies with high-growth potential. The table below shows core data for some high-growth companies in the U.S. stock market:
| Company Name | Projected Sales CAGR | Gross Margin Improvement | Operating Margin Improvement |
|---|---|---|---|
| Eli Lilly (LLY) | 18.7% | Yes | Yes |
| Oracle (ORCL) | 17.6% | Yes | Yes |
| DoorDash (DASH) | 17.4% | Yes | Yes |
| Insulet (PODD) | 17% | Yes | Yes |
| Broadcom (AVGO) | 17% | Yes | Yes |
| Teradyne (TER) | 17% | Yes | Yes |
| Fair Isaac (FICO) | N/A | Yes | Yes |
| Advanced Micro Devices (AMD) | N/A | Yes | Yes |
| Uber (UBER) | N/A | Yes | Yes |
| Meta Platforms (META) | 12.6% | Yes | Yes |
| Micron Technology (MU) | 13.5% | Yes | Yes |
| Netflix (NFLX) | N/A | Yes | Yes |
You can visually understand these companies’ growth trends through the chart below:
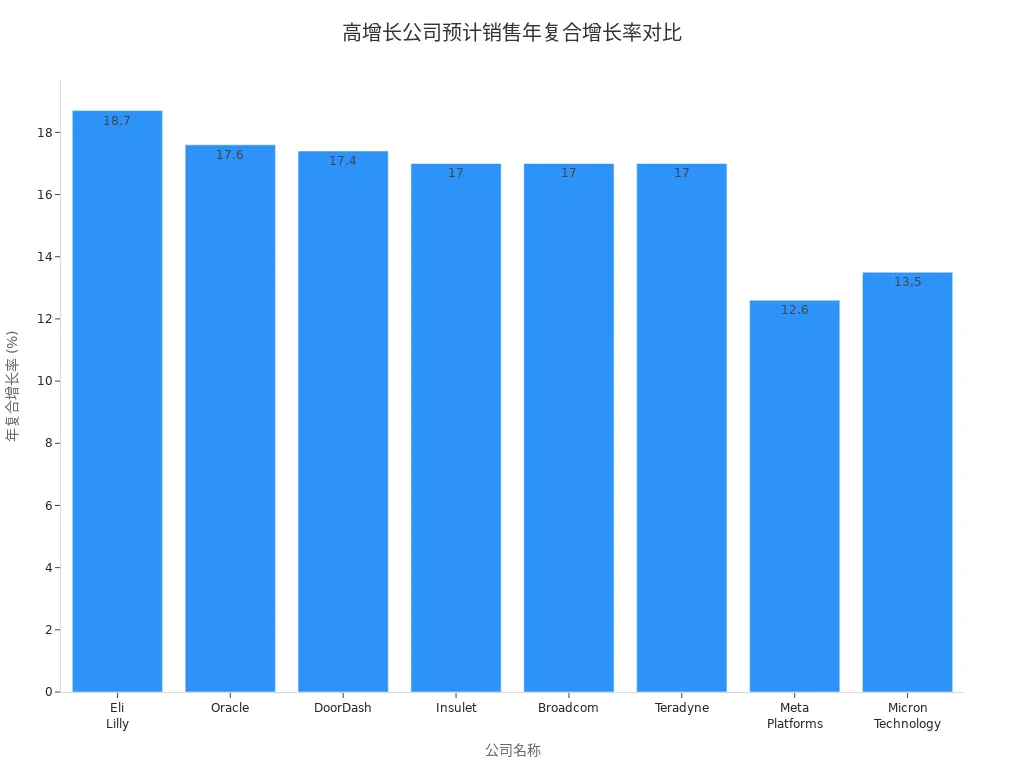
In actual analysis, combining the gross margin piercing-the-fog method allows you to identify the investment value of industry leaders and high-growth companies earlier. This approach helps you make more scientific judgments in complex market environments.
Considerations
Inflated Data Traps
When analyzing gross margins, you need to be cautious of inflated data risks. An unusually high gross margin may not indicate improved business conditions. Common causes include:
- Accounting errors, such as data entry mistakes or inaccurate classification of expenses and revenues.
- Improper revenue recognition, where revenue is recognized early or delayed, affecting gross margins.
- Poor inventory and cost of goods sold management, where inventory valuation or cost of goods sold calculation errors directly impact gross margins.
You can periodically analyze gross margins alongside other financial data to determine whether changes are reasonable. If you notice a sudden significant increase in gross margin, you should further verify the company’s accounting policies and cost calculation methods. Understanding the fundamental factors affecting profit margin fluctuations helps you identify potential financial instability.
Industry Specifics
When comparing gross margins, you must consider industry specifics. Different industries have distinct cost structures and profit models. The table below summarizes common industry factors and their impact on gross margins:
| Industry-Specific Factor | Impact Description |
|---|---|
| Pricing Strategy | Pricing directly affects gross profit; overly high prices may reduce demand, while overly low prices compress margins. |
| Unit Sales Dynamics | Companies with high fixed costs and low variable costs can leverage positive operating leverage to boost margins as sales increase. |
| Fixed vs. Variable Cost Mix | Companies with high fixed costs experience greater margin fluctuations with sales changes, while those with high variable costs may see margins decline as sales grow. |
| Operating Expenses | Sales, administrative, and R&D expenses significantly impact margins, especially when revenue fails to grow proportionally. |
You also need to adjust gross margin evaluation criteria based on industry characteristics. For example, the pharmaceutical industry may have lower gross margins than the Software-as-a-Service (SaaS) industry due to high R&D costs, but this is still reasonable. You can refer to industry averages provided by industry associations or accounting professionals as a starting point for analysis.
Blindly Following Trends
When making investment decisions, you cannot rely solely on gross margin data. Blindly chasing companies with high gross margins may lead to the following issues:
- Misinterpreting a company’s financial health and operational efficiency.
- Ignoring key factors affecting gross margins, such as competitive pressures, cost management, and market changes.
- Lacking comprehensive analysis, which can affect your investment judgment, confidence, and even a company’s long-term sustainability.
You should rationally analyze gross margins in combination with multidimensional metrics like net profit margin and revenue growth to form your own judgment criteria. Only then can you truly identify high-quality and high-growth potential companies.
When selecting stocks, gross margin can help you quickly assess a company’s profitability. Combining operating margin, net profit margin, and return on assets gives you a more comprehensive view of a company’s financial health.
Relying solely on gross margin can overlook other critical metrics, affecting investment judgments.
- Financial ratio analysis drives stock prices, and experts recommend evaluating multiple metrics comprehensively.
- You can refer to industry benchmarks and measure company performance in USD.
Continuously learning financial analysis skills and leveraging professional resources can enhance your stock selection system.
FAQ
What’s the Difference Between Gross Margin and Net Profit Margin?
You can use gross margin to assess a company’s profitability after deducting direct costs from sales revenue. Net profit margin reflects the final profit after accounting for all expenses and taxes.
Why Do Gross Margins Vary Significantly Within the Same Industry?
You’ll find differences in product positioning, brand influence, and cost control capabilities. Technological innovation and management efficiency also affect gross margin performance.
Is a Higher Gross Margin Always Better?
You cannot judge solely based on gross margin levels. High gross margins may result from high pricing or low costs, but you should also analyze revenue growth and market competitiveness.
How Can You Determine If Gross Margin Data Is Reliable?
You can review a company’s financial reports, focusing on accounting policies and cost calculation methods. Comparing historical data and industry averages helps identify anomalies.
Which U.S. Market Industries Typically Have Higher Gross Margins?
You’ll see that software, medical products, and apparel industries typically have higher gross margins. These industries benefit from high product value-added and advantageous cost structures.
Gross Margin is your flashlight for piercing the market fog, helping you quickly isolate companies with superior pricing power and cost management—the hallmarks of quality and growth potential. But after diligently identifying these high-margin global leaders (e.g., in US and HK markets), the reality of high brokerage fees and slow cross-border funding can erode your hard-earned value.
To ensure your sophisticated financial analysis translates into maximized net profit, integrate the financial precision of BiyaPay. We offer zero commission for contract limit orders, a crucial advantage that drastically minimizes the cost of the fractional or long-term purchases essential for building a portfolio of high-quality equities. Furthermore, our platform supports the swift, mutual conversion between fiat and digital assets like USDT, providing you with the fastest, most reliable pathway to fund your brokerage accounts for time-sensitive global investment. You can register quickly—in just 3 minutes without requiring an overseas bank account—and gain immediate access to US and Hong Kong Stocks. Leverage our real-time exchange rate checks to maintain transparent control over your funding costs. Open your BiyaPay account today and secure the operational advantage your rigorous stock selection deserves.
*This article is provided for general information purposes and does not constitute legal, tax or other professional advice from BiyaPay or its subsidiaries and its affiliates, and it is not intended as a substitute for obtaining advice from a financial advisor or any other professional.
We make no representations, warranties or warranties, express or implied, as to the accuracy, completeness or timeliness of the contents of this publication.
Related Blogs of

2025 Taiwan Stock Market Year-End Review and 2026 Outlook: Can the AI Boom Continue?


2026 China Stock Market Investment Guide: Spotlight on 5 Must-Watch Leading Tech Stocks


Ultimate Guide to Applying for a Schengen Visa in the USA in 2025: Understand the Process, Documents, and Timeline in One Article


Want to Invest in the Chinese Stock Market? Start by Understanding the Shanghai Composite Index
Choose Country or Region to Read Local Blog

Contact Us


BIYA GLOBAL LLC is a licensed entity registered with the U.S. Securities and Exchange Commission (SEC No.: 802-127417); a certified member of the Financial Industry Regulatory Authority (FINRA) (Central Registration Depository CRD No.: 325027); regulated by the Financial Industry Regulatory Authority (FINRA) and the U.S. Securities and Exchange Commission (SEC).
BIYA GLOBAL LLC is registered with the Financial Crimes Enforcement Network (FinCEN), an agency under the U.S. Department of the Treasury, as a Money Services Business (MSB), with registration number 31000218637349, and regulated by the Financial Crimes Enforcement Network (FinCEN).
BIYA GLOBAL LIMITED is a registered Financial Service Provider (FSP) in New Zealand, with registration number FSP1007221, and is also a registered member of the Financial Services Complaints Limited (FSCL), an independent dispute resolution scheme in New Zealand.